How a Spring Boot service tells you what it’s doing in production — Actuator endpoints (health, metrics, env, loggers, thread/heap dumps) and the exposure/security rules that stop them leaking secrets; Micrometer as the vendor-neutral metrics facade feeding Prometheus or OTLP; the Observation API that instruments a code path once and emits metrics, traces, and logs together; distributed tracing and correlation IDs in logs; and the RED/SLO thinking that turns raw numbers into on-call signal. Health probes tie directly into 13 - Resilience & Production Readiness; locking the endpoints down uses 08 - Spring Security.
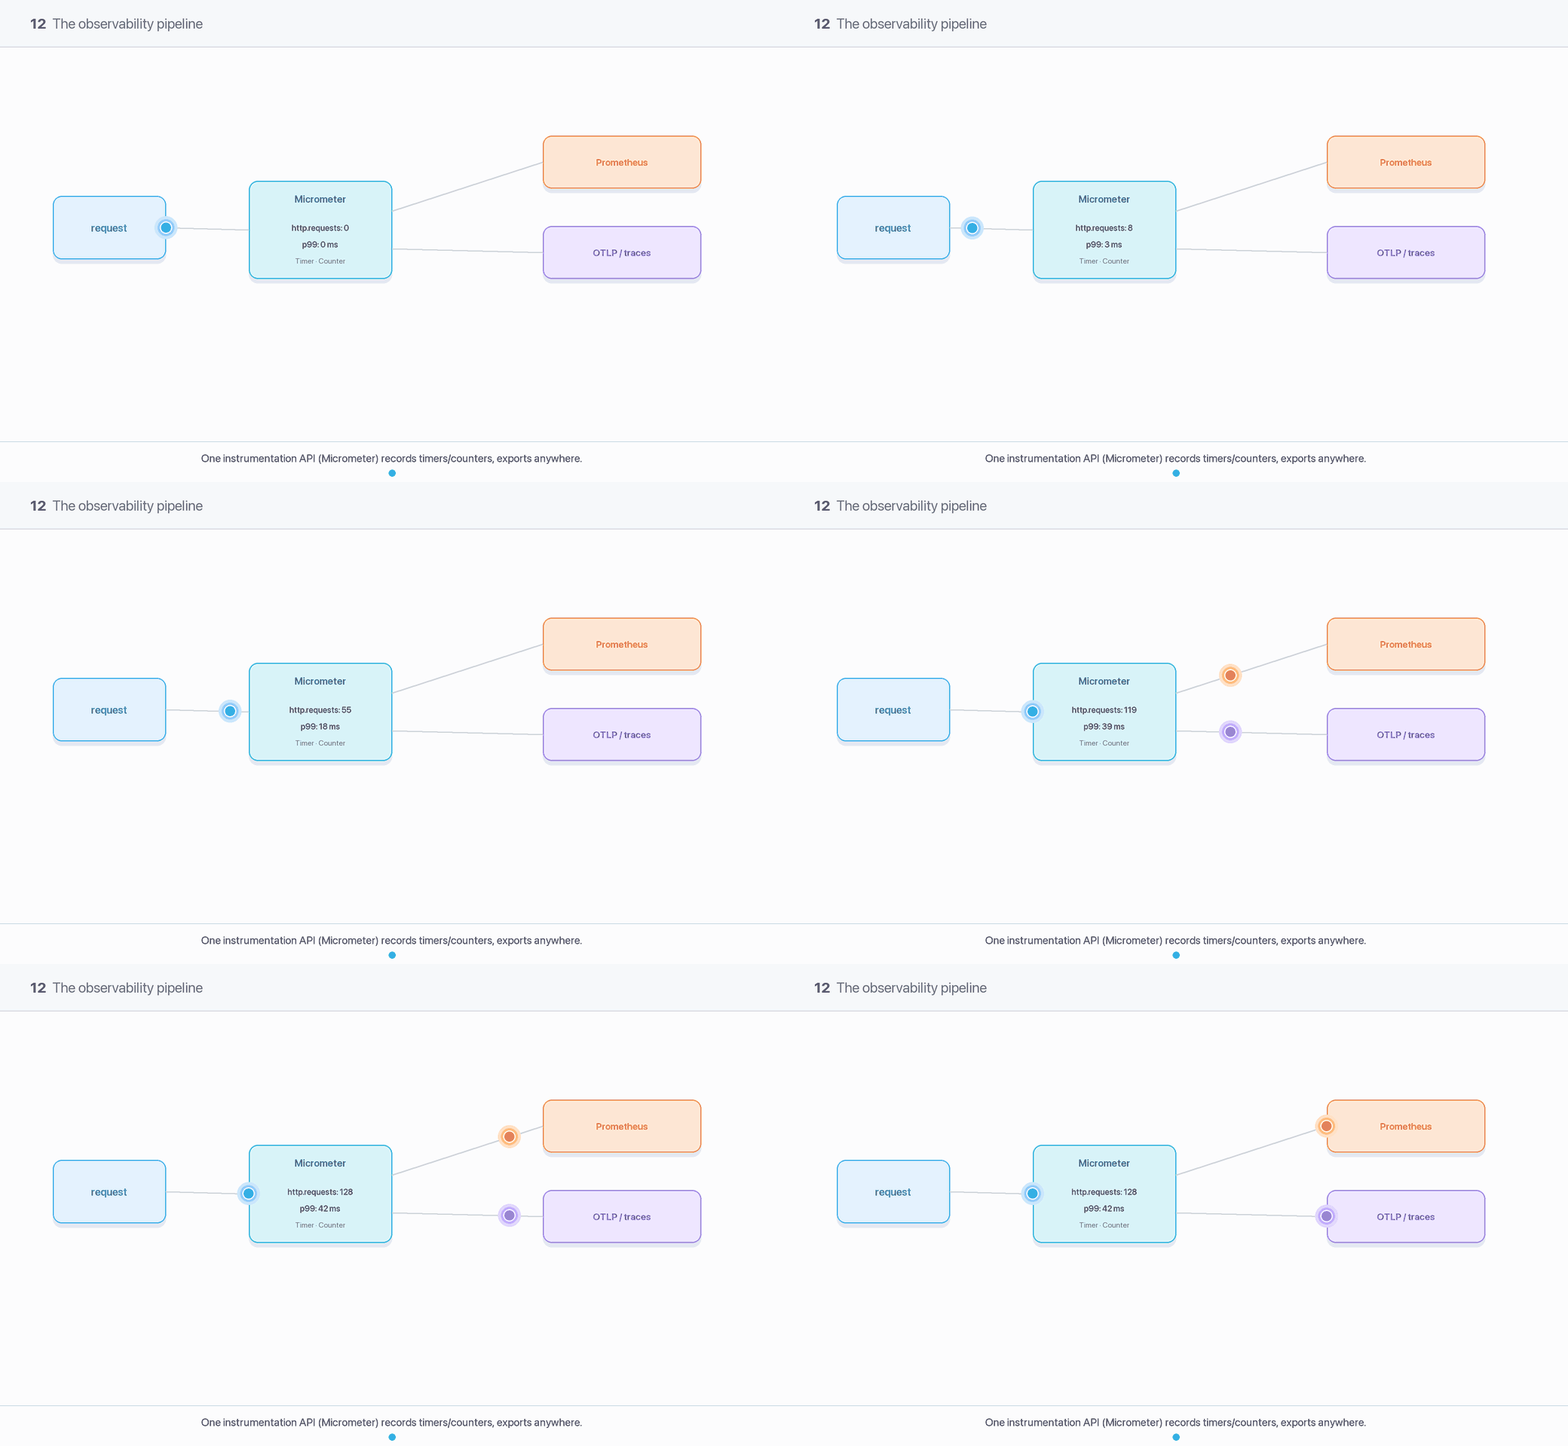
One request is recorded a single time through Micrometer — as timers and counters — then fanned out: scraped by Prometheus as metrics and pushed over OTLP as traces, with the same trace ID stamped into every log line.
1. What Actuator is, and the endpoint catalogue
spring-boot-starter-actuator adds a set of management endpoints — HTTP (and JMX) surfaces that expose the running app’s internals without you writing a controller. They are the standard answer to “is it up, what’s it doing, why is it slow?”
Endpoint id
Tells you
Sensitivity
health
UP/DOWN, aggregated from health indicators (§3)
low (details can leak)
info
build/version/git metadata you populate
low
metrics
Micrometer meter values by name (metrics/{name})
low
prometheus
all meters in Prometheus scrape format (§4)
low
env
every resolved property — including passwords, tokens
high
configprops
bound @ConfigurationProperties values
high
loggers
view and change log levels at runtime (POST)
medium
threaddump
full thread dump — diagnose deadlocks/hangs
medium
heapdump
downloads a full heap.hprof — contains live secrets
POST /actuator/loggers/com.acme.orders with {"configuredLevel":"DEBUG"} flips a package to DEBUG on a live instance, no redeploy, then {"configuredLevel":null} reverts it. It turns “we can’t reproduce it, ship a logging build” into a 5-second toggle during an incident — provided the endpoint is exposed and secured (§9).
2. Exposure control and the management port
Two independent switches gate every endpoint: it must be enabled (most are, by default) andexposed over the chosen transport. This separation is deliberate and the source of most “why can’t I see /metrics?” confusion.
# By default ONLY `health` is exposed over HTTP. Nothing else is reachable.management.endpoints.web.exposure.include=health,info,metrics,prometheus,loggers# base path defaults to /actuator -> /actuator/health, /actuator/metrics, ...management.endpoints.web.base-path=/actuator
Gotcha #1 — exposure.include=* leaks your entire app
Copy-pasting management.endpoints.web.exposure.include=* (common in blogs and Stack Overflow answers) exposes /env and /configprops — which print DB passwords, API keys, and JWT secrets in plaintext — and /heapdump, which lets anyone download a full memory image containing live credentials and user data. On a service reachable from outside the cluster this is a direct, one-request data breach. It is one of the most common real-world Spring misconfigurations. Mitigation: never use *. Enumerate exactly the endpoints you need, and if you must use *, pair it with management.endpoints.web.exposure.exclude=env,configprops,heapdump,threaddump. Then still lock the base path down with auth (§9).
Put management on a separate port
management.server.port=8081 # NOT the traffic port; not on the public LBmanagement.endpoints.web.exposure.include=* # safe(r): 8081 is cluster-internal only
Binding Actuator to a different port from your application traffic lets you expose the useful diagnostic endpoints while keeping them entirely off the public load balancer — your ingress only ever routes :8080, and :8081 is reachable only from inside the cluster / by scrapers. This is the standard production layout.
3. Health indicators, groups, and Kubernetes probes
/actuator/health aggregates HealthIndicator beans — Boot auto-registers them for DataSource, Redis, disk space, Kafka, etc. — into a single UP/DOWN. The overall status is the worst of its parts. You add your own by implementing the interface:
@Componentclass PaymentGatewayHealth implements HealthIndicator { private final PaymentClient client; PaymentGatewayHealth(PaymentClient client) { this.client = client; } @Override public Health health() { try { client.ping(); // fast, cheap liveness of a dependency return Health.up().withDetail("gateway", "reachable").build(); } catch (Exception e) { return Health.down(e).build(); // drags overall /health to DOWN } }}
Health groups slice indicators into named subsets — which is exactly how Boot models Kubernetes probes:
management.endpoint.health.probes.enabled=true # exposes the two groups below# /actuator/health/liveness -> "is the JVM wedged? if so, RESTART me"# /actuator/health/readiness -> "can I serve traffic right now? if not, take me OUT of the LB"management.endpoint.health.group.readiness.include=readinessState,db,paymentGatewaymanagement.endpoint.health.group.liveness.include=livenessStatemanagement.endpoint.health.show-details=when-authorized # never `always` on a public port
Gotcha #2 — conflating liveness and readiness causes restart loops
If you put an external dependency (DB, downstream API) into the liveness probe, then a transient DB blip returns liveness=DOWN, Kubernetes kills and restarts the pod — which does nothing to fix the DB, so the fresh pod also fails, and you get a crash-loop across the whole deployment during an outage you didn’t cause. Liveness answers only “is this process unrecoverable?”; readiness answers “should traffic come to me now?”. Mitigation: liveness = livenessStateonly (in-process state, no I/O). External checks belong in readiness, where failing merely removes the pod from the load balancer until the dependency recovers — no restart. See 13 - Resilience & Production Readiness for graceful shutdown and the readiness↔traffic handshake.
Gotcha #3 — an expensive health check that hammers the thing it checks
Probes are polled every few seconds per pod. A HealthIndicator that runs SELECT count(*) on a big table, or a full downstream round-trip, multiplies into hundreds of heavy calls per minute and can itself take down the dependency — a self-inflicted DoS via monitoring. Mitigation: keep indicators O(1) — a connection-validation query (SELECT 1), a cached/last-known status, or a lightweight ping. Cache expensive results with management.endpoint.health.group.<g>.… TTL-style custom indicators, and prefer readiness over adding cost to liveness.
4. Micrometer: the metrics facade and its registries
Micrometer is SLF4J for metrics — you instrument against a vendor-neutral API (MeterRegistry), and a registry implementation on the classpath ships those meters to a specific backend. Swap Prometheus for OTLP by changing a dependency, not your code.
Meter
Measures
Example
Counter
a monotonically increasing count
orders placed, errors thrown
Gauge
an instantaneous value that goes up and down
queue depth, cache size, active connections
Timer
count and latency distribution of short events
HTTP request duration, method timing
DistributionSummary
distribution of a non-time value
payload sizes in bytes, batch counts
@Serviceclass OrderService { private final Counter placed; private final Timer checkout; OrderService(MeterRegistry registry) { this.placed = registry.counter("orders.placed", "channel", "web"); this.checkout = registry.timer("orders.checkout", "channel", "web"); } Order checkout(Cart cart) { return checkout.record(() -> { // records latency + count in one call Order o = doCheckout(cart); placed.increment(); return o; }); }}
Two export models — the key architectural choice:
Model
How it moves
Registry dep
Failure mode
When to pick
Prometheus (pull)
Prometheus scrapesGET /actuator/prometheus on a schedule
micrometer-registry-prometheus
scraper down → gap in graphs, app unaffected
you run Prometheus/Grafana; want simple, debuggable, per-instance targets; the mainstream default
OTLP (push)
app pushes to an OTLP collector/backend
micrometer-registry-otlp
backend/collector down → app buffers, may drop; back-pressure on app
vendor APM (Datadog/Honeycomb/Grafana Cloud) via a collector; serverless/short-lived pods that die before a scrape; unified OTel pipeline for metrics+traces+logs
Gotcha #4 — high-cardinality tags OOM the app
A metric’s memory cost is one time series per unique combination of tag values. Tagging with a userId, requestId, orderId, or a raw URI containing IDs (/orders/98213) creates a new time series for every distinct value — millions of them. The registry holds every series in heap; the graph is unbounded. The result is steadily climbing memory and an eventual OutOfMemoryError that looks like a leak but is your own instrumentation. Mitigation: tags must be low-cardinality — bounded, enumerable dimensions (method, status, outcome, channel). Never tag with unbounded IDs. Use templated URIs (/orders/{id}, which Boot’s HTTP metrics do automatically), and if you truly need per-entity detail, that’s a log or a trace, not a metric tag. Set management.metrics.web.server.max-uri-tags as a safety cap.
Free, high-value meters you already have
With Actuator on the classpath Boot auto-instruments http.server.requests (Timer per route+status), JVM memory/GC/threads, the DataSource/HikariCP pool, and cache hit ratios — no code. Wire dashboards to these before writing custom meters; most latency and saturation questions are answerable from the built-ins.
5. The Observation API — instrument once, emit everywhere
Historically you instrumented metrics (Micrometer) and traces (Sleuth/Brave) separately, duplicating the same start/stop boundaries. Micrometer’s Observation API unifies them: you record one Observation around a code path, and registered ObservationHandlers turn that single event into a metric timer, a trace span, and a log — consistently named, with the same tags.
@Serviceclass InventoryService { private final ObservationRegistry registry; InventoryService(ObservationRegistry registry) { this.registry = registry; } Stock reserve(String sku, int qty) { return Observation.createNotStarted("inventory.reserve", registry) .lowCardinalityKeyValue("warehouse", "eu-west") // becomes a metric tag AND a span attribute .highCardinalityKeyValue("sku", sku) // trace-only; NOT a metric tag (see §4) .observe(() -> doReserve(sku, qty)); // times it, spans it, logs it — once }}
The distinction interviewers probe: lowCardinalityKeyValue vs highCardinalityKeyValue
Low-cardinality keys flow to metrics and traces (safe to aggregate). High-cardinality keys flow to traces only. This is the API encoding the §4 rule for you — the sku/userId you must never make a metric tag is exactly what makes a trace useful for debugging a single request. Getting this right is what separates “I’ve used Micrometer” from “I understand the observability model.”
6. Distributed tracing — the Micrometer Tracing bridge
For a request crossing several services, tracing stitches the per-service spans into one trace so you can see where the latency actually went. Micrometer’s Observations already create spans; you add a bridge that exports them.
management.tracing.sampling.probability=0.1 # 10% default; 1.0 only in dev/low-trafficmanagement.opentelemetry.tracing.export.otlp.endpoint=http://otel-collector:4318/v1/traces
Context propagation is automatic only through Boot’s auto-configured clients — RestClient.Builder, RestTemplateBuilder, WebClient.Builder. The trace/span IDs travel over W3C traceparent headers, and Boot injects them into MDC so every log line carries them:
# Boot's default correlation pattern -> [service,traceId,spanId] in each log linelogging.pattern.correlation=[${spring.application.name:},%X{traceId:-},%X{spanId:-}]
Gotcha #5 — hand-built HTTP clients drop the trace
new RestTemplate() or a raw HttpClient you new up yourself is not instrumented — the span context is never injected into the outgoing headers, so the downstream service starts a fresh, disconnected trace. Symptom: traces mysteriously end at a service boundary and logs on the two sides can’t be correlated. Mitigation: always inject and use the auto-configured builders (RestClient.Builder, WebClient.Builder); never instantiate the client type directly. This is the tracing analogue of the DI discipline in 02 - IoC Container, Beans & Dependency Injection.
7. Structured (JSON) logging — built in since Boot 3.4
VERIFIED — no encoder dependency needed since 3.4
Before Spring Boot 3.4 (Nov 2024) you needed the logstash-logback-encoder dependency and a custom logback-spring.xml to emit JSON. Since 3.4 it is native: one property switches console/file output to structured JSON so a log shipper (ELK, Loki, Datadog) can parse fields instead of regex-scraping text. [HIGH-CHURN: feature is stable in 4.1.x; re-verify supported formats against the current reference.]
logging.structured.format.console=ecs # ecs (Elastic), gelf (Graylog), or logstashlogging.structured.json.add.env=${DEPLOY_ENV} # inject a static field into every line
Because the trace/span IDs from §6 are in MDC, structured JSON automatically carries trace_id/span_id as queryable fields — the mechanical link between a slow trace and its logs. In a container you almost always want JSON to console (stdout) and let the platform collect it; keep human-readable format only for local dev.
8. The RED method and SLOs — what to actually measure
Endpoints and meters are plumbing; RED is the discipline that says which meters matter for a request-driven service:
Rate — requests per second (rate(http_server_requests_seconds_count[1m])).
Errors — the fraction that failed (5xx / total; tag outcome/status).
Duration — the latency distribution, read at percentiles (p95/p99), never the mean.
# emit a histogram so Prometheus/Grafana can compute p95/p99 and SLO burn accuratelymanagement.metrics.distribution.percentiles-histogram.http.server.requests=truemanagement.metrics.distribution.slo.http.server.requests=100ms,300ms,1s
Alert on SLOs and symptoms, not on causes
An SLO (“99% of checkout requests < 300 ms over 30 days”) is a promise expressed in RED terms; its error budget is how much you may violate it before you stop shipping features and fix reliability. Page on-call when a user-visible symptom breaches the budget (error rate up, p99 latency up) — not on causes like “CPU 80%” or “a pod restarted”, which fire constantly and train people to ignore alerts. Averages hide outages: a 50 ms mean can hide a 4 s p99 that’s failing every important customer. Always alert on percentiles.
9. Securing Actuator (tie-in: Spring Security)
The endpoints from §1 are diagnostic power, which is exactly why they’re a target. On any port reachable beyond the cluster, they must be authenticated and authorized.
@BeanSecurityFilterChain actuator(HttpSecurity http) throws Exception { http.securityMatcher(EndpointRequest.toAnyEndpoint()) // matches /actuator/** .authorizeHttpRequests(a -> a .requestMatchers(EndpointRequest.to("health")).permitAll() // probes must be open .anyRequest().hasRole("ADMIN")) // everything else: admin only .httpBasic(Customizer.withDefaults()); return http.build();}
Committed best practices (defense in depth)
Separate management port (§2), reachable only inside the cluster — the strongest single control.
show-details=when-authorized, never always, so an anonymous /health can’t enumerate your dependency topology.
Probes (health/liveness, health/readiness) stay permitAll — Kubernetes calls them unauthenticated; everything else requires a role.
Never exposure.include=* on the public port; enumerate, and exclude env/heapdump/configprops if you must wildcard.
Property masking: /env and /configprops sanitize keys matching password/secret/key/token by default — don’t disable it, and name your secret properties so they match. See 08 - Spring Security for the filter-chain mechanics.
10. Choosing an export path — trade-offs
Concern
Metrics (Micrometer→Prometheus/OTLP)
Tracing (spans→OTLP/Zipkin)
Logs (structured JSON)
Answers
how much / how often / how slow (aggregate)
where the time went across services (per-request)
what exactly happened (per-event detail)
Cardinality
must be low (§4) — bounded tags
high OK — per-request
unbounded — full context
Cost at scale
cheap (pre-aggregated)
sampled (§6) to control cost
most expensive (volume)
Retention
long (months)
short (days), sampled
medium, volume-driven
When to reach for it
dashboards, alerting, SLOs, capacity
debugging a specific slow/failed request path
forensic detail, audit, the “why” behind a trace
The committed recommendation
Use the three together, correlated: alert off metrics (RED/SLO), pivot to the trace for the failing request, then jump to the logs for that exact trace_id. Because the Observation API (§5) produces all three from one instrumentation with shared IDs, this pivot is a click, not a re-instrumentation project. For transport in 2026, Prometheus pull remains the pragmatic default for metrics if you self-host Grafana; move to a unified OTLP push pipeline when you adopt a managed APM or want metrics, traces, and logs flowing through one OpenTelemetry Collector.
11. Caveats & risk mitigation (summary)
Exposure is opt-in for a reason (§2). Only health is public by default; never wildcard on a public port; prefer a separate management port.
Liveness ≠ readiness (§3). External deps go in readiness, never liveness — or you crash-loop during outages you didn’t cause.
Health checks stay cheap (§3). Probes poll constantly; an expensive indicator is a self-DoS.
Tags stay low-cardinality (§4). IDs in metric tags are the classic OOM; per-request detail is a trace/log, not a tag.
Instrument once via Observations (§5). One Observation → metrics + traces + logs with shared IDs beats three parallel instrumentations.
Use the auto-configured HTTP builders (§6) or traces silently break at service boundaries.
Alert on symptoms/SLOs at percentiles (§8), not on causes or averages.
Version facts are volatile. Spring Boot 4.1.x on Framework 7 / Jakarta EE 11 / JDK 17 baseline (up to JDK 26), structured logging since 3.4, tracing coordinates changed in 4.x — re-verify exact artifact ids and property keys before relying on them.
12. In practice
# application.properties — a sane production Actuator baselinemanagement.server.port=8081 # internal-only management port (§2)management.endpoints.web.exposure.include=health,info,metrics,prometheus,loggersmanagement.endpoint.health.show-details=when-authorized # never `always` (§9)management.endpoint.health.probes.enabled=true # k8s liveness/readiness (§3)management.tracing.sampling.probability=0.1 # 10% traces (§6)management.metrics.distribution.percentiles-histogram.http.server.requests=true # p95/p99 (§8)logging.structured.format.console=ecs # JSON to stdout since 3.4 (§7)logging.pattern.correlation=[${spring.application.name:},%X{traceId:-},%X{spanId:-}]
Interview talking points to be able to defend:
“Only health is exposed by default; exposure.include=* on a public port leaks /env and /heapdump — I enumerate endpoints and put management on a separate internal port.”
“Liveness checks in-process state only; external dependencies go in readiness — otherwise a DB blip restart-loops the whole deployment.”
“Micrometer is the metrics facade; the killer failure is high-cardinality tags — a userId tag OOMs the registry. IDs belong in traces/logs, not metric tags.”
“The Observation API instruments a path once and emits metric + span + log with the same trace ID, so metrics→trace→logs is one correlated pivot.”
“I alert on SLOs and symptoms at p95/p99, never on averages or causes like CPU.”
“Prometheus pull is my default; I move to OTLP push when adopting a managed APM or a unified OpenTelemetry Collector.”