14 - Observability & Debugging — Why Isn't It Scaling
21 min read
Scope
The module you open at 2 a.m. A numbered drill that walks the scaling path from the ScaledObject to the broker and stops at the first thing that’s actually broken; how to read the four status conditions; a symptom → cause → fix table; the Prometheus metric names that are real (several widely-quoted ones aren’t); and an opinionated answer to what should I alert on. The one idea to take away: debug in path order, not in panic order. Almost every “KEDA isn’t scaling” ticket is one of six things, and the drill below finds which in under five minutes.
Written against KEDA v2.20 · Kubernetes 1.33–1.35 · Apache Kafka 4.3
Metric names and status-condition reasons move between minor releases — KEDA’s CRDs stay v1alpha1 on purpose, so breaking changes ship in minors (15 - Production Operations). Everything below is verified for v2.20; re-check against the Prometheus integration page for whatever version you run.
1. The drill — in this order, every time
The value here is the order. Each step tests one hop in the path from your ScaledObject to your broker, and the first step that fails is your answer. Do not skip ahead: 80% of tickets die at step 1 or 2, and both are ten-second checks.
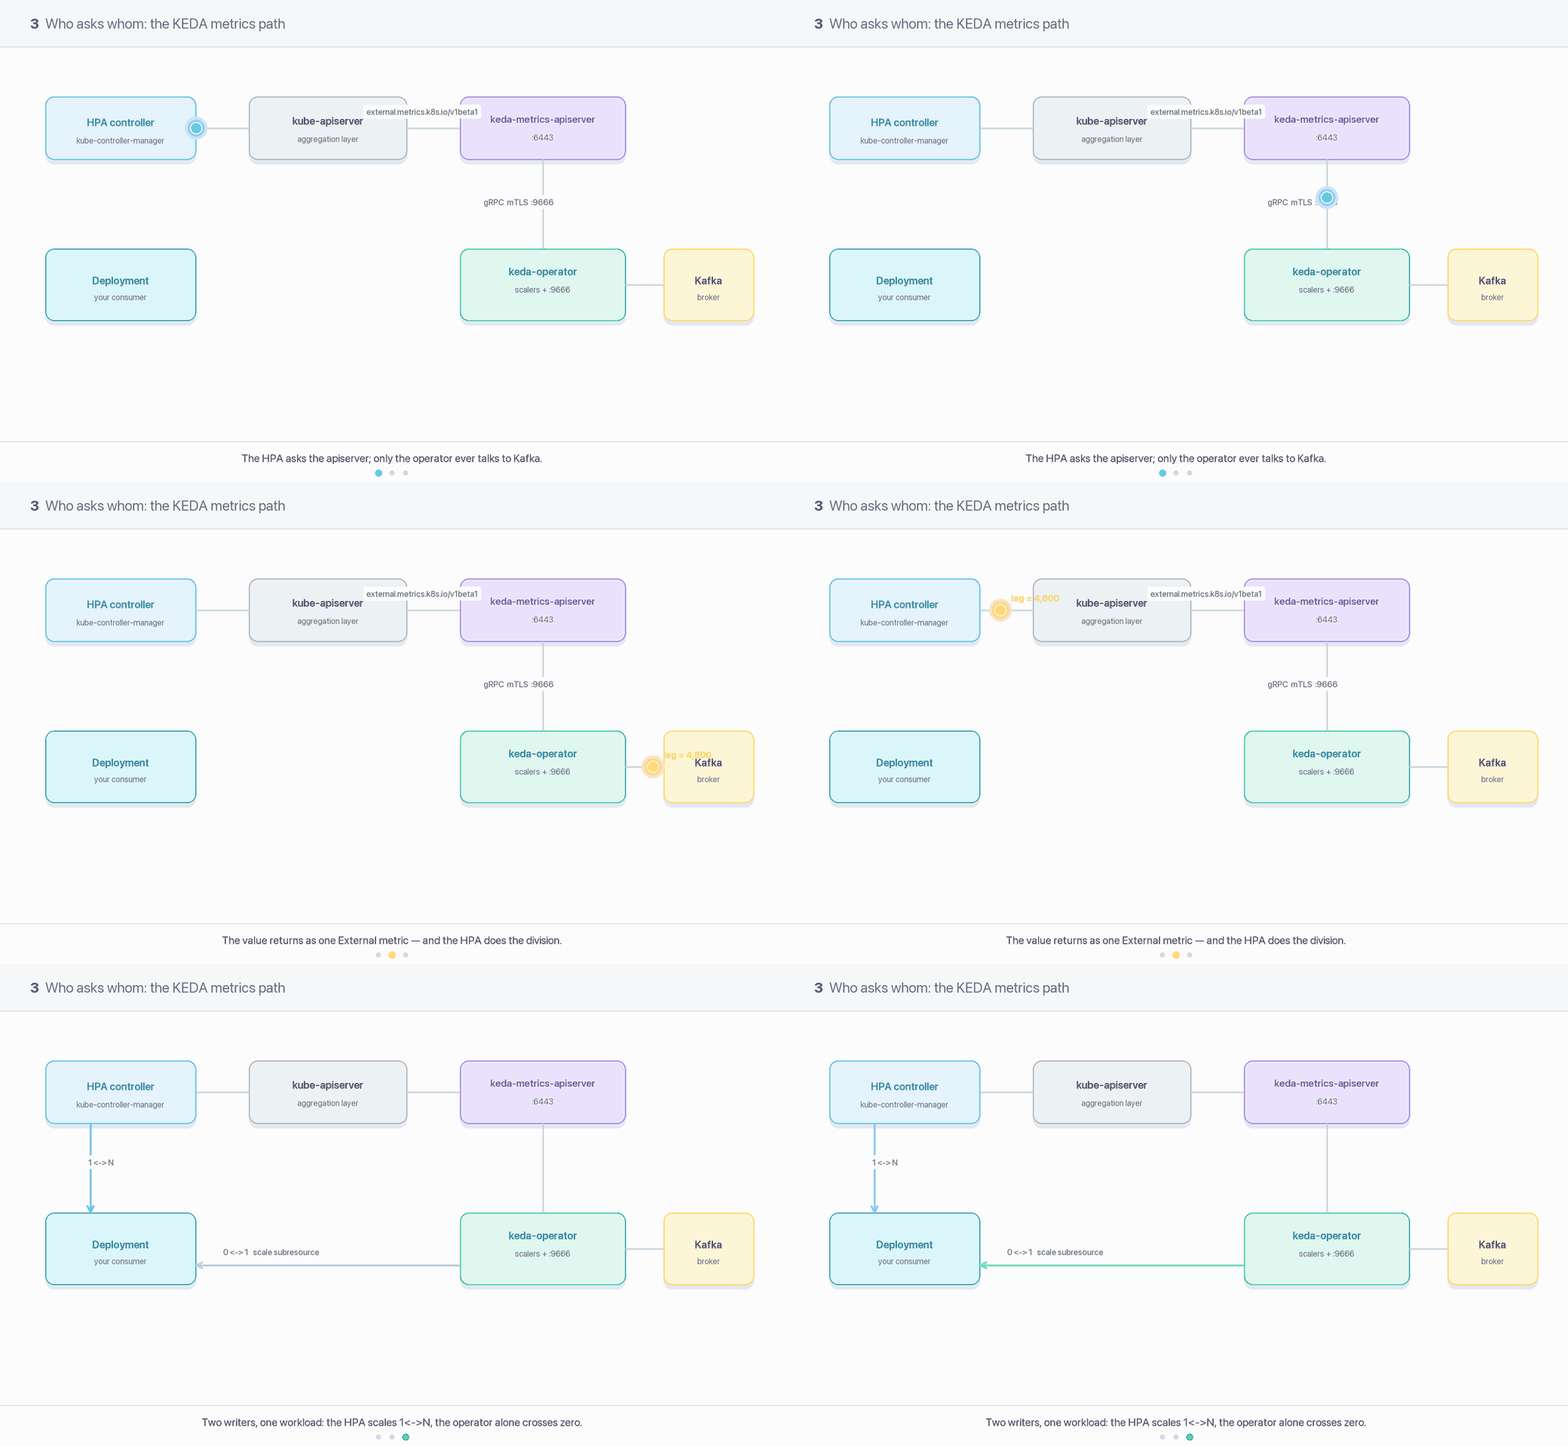
  ScaledObject  →  HPA  →  external metrics API  →  KEDA metrics server
        ↓                                                   ↓
   operator                                        gRPC to the operator
        ↓                                                   ↓
   scale subresource                              scaler  →  Kafka broker
Step 1 — Is the ScaledObject Ready?
kubectl -n lab get scaledobject
NAME SCALETARGETKIND SCALETARGETNAME MIN MAX TRIGGERS READY ACTIVE FALLBACK PAUSED AGEorders-so apps/v1.Deployment orders-consumer 0 12 kafka True True False Unknown 6d
READY=True means KEDA parsed the spec, built the scalers and created the HPA. Anything else — False, Unknown, or the column blank — and nothing downstream can work. Go straight to:
kubectl -n lab describe scaledobject orders-so
Read two things: the Conditions block (§2) and the Events at the bottom. KEDAScalersStarted means the trigger connected. KEDAScaleTargetActivated / KEDAScaleTargetDeactivated are KEDA’s own 0↔1 decisions. A condition reason of TriggerError or PartialTriggerError (“Some triggers defined in ScaledObject are not working correctly”) points at credentials or connectivity, not at your scaling maths.
Two extra status fields earn their keep here:
# per-trigger activity — which trigger thinks there's work? (KEDA v2.19+)kubectl -n lab get scaledobject orders-so -o jsonpath='{.status.triggersActivity}'# per-metric failure counters, Happy or Failingkubectl -n lab get scaledobject orders-so -o jsonpath='{.status.health}'
Step 2 — Is it Active? (and remember: Active=False is often correct)
Active answers “does KEDA believe there is work right now” — nothing more. With minReplicaCount: 0, Active=False is what keeps you at zero replicas, and it is the desired state on a drained topic.
Active=False with lag below the activation threshold is correct behaviour, not a fault
The reason string tells you which flavour of “not active” you’re looking at. ScalerNotActive — “Scaling is not performed because triggers are not active” — means lag is at or below activationLagThreshold and the workload should be at zero. ScalerCooldown — “Scaler cooling down because triggers are not active” — means KEDA has already decided to deactivate and is waiting out cooldownPeriod (default 300 s) before writing 0.
If you expected pods and see ScalerNotActive, the bug is almost always that activationLagThreshold is above your actual lag (08 - Scale-to-Zero & Activation) — not that KEDA is broken.
Note the asymmetry that trips people: if minReplicaCount is 1 or more, activation values are ignored entirely and the scaler is always considered active. Active=True on an idle topic is then expected too.
Step 3 — Does the HPA exist, and can it read its metric?
KEDA creates one HPA per ScaledObject, named keda-hpa-<scaledobject-name> unless you overrode it. Don’t guess:
Healthy looks like this — a number over a number, and ScalingActive=True:
Metrics: ( current / target ) "s0-kafka-orders" (target average value): 347 / 100Conditions: Type Status Reason Message AbleToScale True ReadyForNewScale recommended size matches current size ScalingActive True ValidMetricFound the HPA was able to successfully calculate a replica count ScalingLimited False DesiredWithinRange the desired count is within the acceptable range
Broken looks like this:
Metrics: ( current / target ) "s0-kafka-orders" (target average value): <unknown> / 100Conditions: Type Status Reason Message ScalingActive False FailedGetExternalMetric unable to get external metric ...
Gotcha — <unknown> in TARGETS does not mean lag is zero
kubectl get hpa renders <unknown>/100 whenever the HPA could not retrieve the metric at all. People read it as “no lag, nothing to do” and go looking at the consumer. It actually means the metric path is broken — the external metrics APIService, the KEDA metrics server, the gRPC hop to the operator, or the scaler itself. Real zero lag renders as 0/100. Mitigation: treat <unknown> as a hard failure and continue to steps 4 and 5. 0 is a data point; <unknown> is an outage.
Also worth knowing: current here is lag per replica, because the default metricType is AverageValue. With lagThreshold: 100 and 4 pods, 347 means roughly 1,388 total lag. Comparing that number directly against kafka-consumer-groups.sh output and concluding KEDA is wrong is a very common false alarm.
Step 4 — Is the external-metrics APIService Available?
kubectl get apiservice v1beta1.external.metrics.k8s.io
NAME SERVICE AVAILABLE AGEv1beta1.external.metrics.k8s.io keda/keda-operator-metrics-apiserver True 6d
If this says False, nothing else in KEDA works and no other check is meaningful. Look at the metrics-server pod, then at whether something else in the cluster is also trying to serve external.metrics.k8s.io — Kubernetes allows exactly one provider of that API group per cluster, so a stray prometheus-adapter serving external metrics will fight KEDA for it (15 - Production Operations).
kubectl -n keda get podskubectl -n keda logs deploy/keda-operator-metrics-apiserver --tail=50
Step 5 — Fetch the metric by hand
This is the single most decisive command in the module: it asks the aggregated API exactly what the HPA asks, and cuts KEDA’s own reporting out of the loop.
# 1. read the metric name from the ScaledObject — never guess itkubectl -n lab get scaledobject orders-so -o jsonpath='{.status.externalMetricNames}'# → ["s0-kafka-orders"]# 2. ask the API for itkubectl get --raw \ "/apis/external.metrics.k8s.io/v1beta1/namespaces/lab/s0-kafka-orders?labelSelector=scaledobject.keda.sh/name=orders-so" \ | jq
Two things that make this command fail for boring reasons
The labelSelector is mandatory. KEDA’s metrics server uses the scaledobject.keda.sh/name label to work out which ScaledObject a metric request belongs to. Omit it and you get an error that looks like a KEDA fault. (The docs write the selector percent-encoded — scaledobject.keda.sh%2Fname%3Dorders-so — which is also fine.) The metric name is generated, not chosen. It’s the trigger index plus a normalised scaler name: s0-kafka-orders for trigger 0 on topic orders. Read it out of .status.externalMetricNames and copy-paste. Hand-typed metric names are a large share of “the raw query returns nothing”.
If step 5 returns a sensible number and the HPA still shows <unknown>, the problem is between the API server and the HPA controller. If step 5 fails, the problem is inside KEDA or between KEDA and Kafka — continue.
Step 6 — Ask the event source directly
KEDA can only report what the broker tells it. Get ground truth before blaming the autoscaler:
GROUP TOPIC PARTITION CURRENT-OFFSET LOG-END-OFFSET LAGorders-workers orders 0 - 3827 - <- never consumedorders-workers orders 3 3526 3526 0 <- caught uporders-workers orders 5 1248 2881 1633 <- working
Three readings to take:
Is CURRENT-OFFSET advancing? Run it twice, ten seconds apart. If offsets are frozen while pods are busy, your consumer isn’t committing — KEDA is faithfully reporting real committed lag and scaling up forever is the correct response to what it can see.
Are there - rows? A partition with no committed offset has undefined lag, and offsetResetPolicy decides how KEDA counts it: earliest counts the whole log, latest counts zero. Mismatching this against your consumer’s auto.offset.reset is the most common Kafka-on-KEDA bug.
Also useful: --describe --group orders-workers --state shows group state and member count, which tells you whether a rebalance is in progress.
Step 7 — Read the operator logs
Last, not first. By now you know which hop failed, so you know what to grep for.
kubectl -n keda logs deploy/keda-operator -f | grep -Ei "orders-so|scaledobject|scaling|metric|error"
The operator logs its polling results, its activation and deactivation decisions, and every scaler error with the underlying client message — which is where authentication and TLS failures actually surface (12 - Authentication — TriggerAuthentication, SASL, TLS & MSK IAM).
2. The four status conditions
Every ScaledObject carries exactly four conditions. Read them as a set, not individually.
Ready=True, Active=False is the normal idle state of a scale-to-zero workload. It is not a half-broken condition, and it is the single most misread pair in KEDA.
Two reasons on Ready are newer (v2.20) and worth recognising, because before v2.20 the ScaledObject would cheerfully report Ready=True while its HPA was unable to fetch anything:
HPAMetricsUnavailable — KEDA looked at its own HPA, saw the HPA’s ScalingActive condition was false, and propagated that. Translation: the metric path is broken downstream of me. Your next move is drill step 4 and 5, not the ScaledObject spec.
ScalingDegraded — the same discovery, but the ScaledObject was already not-ready for another reason. Translation: more than one thing is wrong.
There is a one-minute grace period after HPA creation before this feedback kicks in, so a freshly applied ScaledObject briefly showing Ready=True with an empty HPA is expected.
Gotcha — Paused hides in plain sight, and any annotation value pauses
autoscaling.keda.sh/paused and autoscaling.keda.sh/paused-replicas stop KEDA acting, and the ScaledObject otherwise looks perfectly healthy — Ready=True, metric flowing, no errors, no events. Worse, KEDA treats a non-boolean value as true: paused: "maybe", paused: "no" and paused: "" all pause. Someone pauses a workload during an incident, the incident ends, the annotation stays, and three weeks later it “stopped autoscaling”. Mitigation: make kubectl get scaledobject (which prints the PAUSED column) part of the drill, alert on keda_scaled_object_paused, and remember that to resume you remove the annotation — setting paused-replicas to something else does not un-pause it.
3. Symptom → cause → fix
The most useful artefact in this module. Find your symptom, then confirm the cause with the drill step named.
Symptom
Most likely cause
Fix / next command
Nothing scales at all; READY=False
trigger can’t connect, bad credentials, or invalid metadata
Deleted the ScaledObject and the workload froze at 0 replicas
replicas are not restored on delete by default
scale the Deployment manually; set advanced.restoreToOriginalReplicaCount: true next time
4. KEDA’s own Prometheus metrics
KEDA exposes Prometheus metrics on port 8080 on each component. These are the names verified for v2.20 — and the ones that matter:
Metric
What it tells you
keda_scaler_metrics_value
the value each scaler last reported — i.e. the number the HPA divides
keda_scaler_active
per-scaler activity: is this trigger above its activation threshold?
keda_scaler_detail_errors_total
scaler errors, per scaler — your primary “KEDA can’t reach the event source” signal
keda_scaled_object_errors_total
errors per ScaledObject, i.e. reconcile-level failures
keda_scaled_object_paused
is this ScaledObject paused? (see the gotcha in §2)
Gotcha — several widely-cited KEDA metric names do not exist
Blog posts, dashboards and AI-generated alert rules routinely use keda_scaler_errors, keda_scaled_object_errors, keda_trigger_totals, keda_resource_totals and keda_internal_scale_loop_latency. None of those are current names — the real ones carry _total / _seconds suffixes or a different noun (keda_scaler_detail_errors_total, keda_scaled_object_errors_total). A rule built on a name that doesn’t exist evaluates to “no data” forever and never fires, which is indistinguishable from “everything is fine”. Mitigation: confirm every name against a live scrape before writing a rule — kubectl -n keda port-forward deploy/keda-operator 8080:8080 then curl -s localhost:8080/metrics | grep '^keda_'. Then check in Prometheus that each new rule’s expression returns a series today, not just that it doesn’t error.
The gotcha that costs people an afternoon
The KEDA binary’s own default for --enable-prometheus-metrics is true. The Helm chart renders that flag from a value whose default is false. So a plain helm install kedacore/keda gives you an operator with metrics switched off, while every doc, blog post and dashboard assumes they’re on.
Gotcha — the Helm chart ships Prometheus metrics disabled, contrary to the binary's default
prometheus.operator.enabled, prometheus.metricServer.enabled and prometheus.webhooks.enabled all default to false. Symptom: the endpoint is scrapeable and the /metrics path returns something (Go runtime and controller-runtime metrics), but not a single keda_-prefixed series. People conclude their scrape config, relabelling or ServiceMonitor is wrong and spend hours there. Mitigation: enable them explicitly, and put it in your values file rather than a one-off flag:
helm upgrade keda kedacore/keda -n keda --version 2.20.1 \
  --set prometheus.operator.enabled=true \
  --set prometheus.metricServer.enabled=true
Then verify: curl -s localhost:8080/metrics | grep -c '^keda_' should be well above zero.
Two follow-on details worth knowing. The three components are not symmetric: the operator’s value genuinely toggles a command-line flag, whereas the metrics server always serves its metrics port and its value only gates the ports, annotations and monitor objects. And the ServiceMonitor / PodMonitor / PrometheusRules sub-trees each have their own enabled: false, so turning metrics on does not by itself make Prometheus scrape them — you still need a monitor object or a scrape config.
5. Grafana
There is no KEDA dashboard on grafana.com — there is no dashboard ID to import
Searching grafana.com’s dashboard catalogue for KEDA returns nothing. Any tutorial that tells you to “import dashboard ID n” for KEDA is citing something that doesn’t exist.
What does exist is a first-party dashboard JSON in KEDA’s own repository, which you import by pasting the file contents into Grafana’s Dashboards → New → Import → paste JSON box:
It’s titled “KEDA”, carries nine panels, and takes its Prometheus datasource from a dashboard variable, so you pick the datasource on import rather than editing the JSON. The panels cover:
Metric Server — is the metrics adapter answering?
Scaler Total Errors and Scaler Errors — the error signals from §4
Scaled Object Errors — reconcile-level failures per ScaledObject
Scale Target and Scaler Metric Value — the number KEDA is reporting per trigger
Current / max replicas and Changes in replicas — the scaling outcome over time
Its queries are built on keda_scaler_metrics_value, keda_scaler_active, keda_scaled_object_errors_total and keda_scaler_detail_errors_total — which is a useful cross-check that those are the right names.
Best practice — treat the shipped dashboard as a diagnosis panel, not a monitoring dashboard
It shows you what KEDA thinks. It cannot show you what your broker thinks, and for Kafka those two deliberately differ (§6). Put the KEDA dashboard next to a real consumer-lag dashboard, and read them together.
6. What to alert on — and what not to
Be opinionated here, because the obvious choice is the wrong one.
Gotcha — do NOT alert on keda_scaler_metrics_value for Kafka
The Kafka scaler deliberately clamps the value it reports at partitions × lagThreshold, so that the HPA’s own division lands exactly on the partition count. Real lag of 90,000 on a 12-partition topic with lagThreshold: 500 is reported as 6,000 — and it stays at 6,000 no matter how far behind you fall. An alert threshold on that series is silently un-triggerable above the ceiling: during a genuine backlog emergency the metric looks flat and healthy. This is by design, not a bug (07 - The Kafka Scaler — Every Field & the Replica Math). Mitigation: alert on real consumer lag from Kafka itself or a dedicated lag exporter. Use keda_scaler_metrics_value for dashboards and debugging only — it is excellent for answering “what number did KEDA hand the HPA”, which is a different question from “are we behind”.
The four alerts worth having:
Alert on
Why
Rough shape
Real consumer-group lag from Kafka or a lag exporter
the only signal that measures the thing your users feel
lag above your SLO budget for N minutes, per group and topic
Scaler errors — rate(keda_scaler_detail_errors_total[5m]) sustained above zero
KEDA can’t reach the event source; scaling is running blind and may be in fallback
any sustained non-zero rate, per scaler
ScaledObject not Ready
the whole scaling path is down for that workload, and nothing else will tell you
export CR conditions with a custom-resource exporter, or run a scripted kubectl get so -A check
Sustained time at maxReplicaCount
you are saturated: either the ceiling is wrong, or the consumer can’t keep up, or partitions cap you
HPA current replicas equal to max for N minutes, via your HPA metrics
Add keda_scaled_object_paused as a low-severity, long-window alert — it catches the “someone paused it during an incident and never un-paused it” failure, which nothing else catches. And keda_scaled_object_errors_total as a companion to the scaler errors: scaler errors mean “the event source is unreachable”, ScaledObject errors mean “KEDA is failing to reconcile this object at all”.
The alerting rule of thumb
Alert on the event source and on KEDA’s health. Never alert on KEDA’s reported value. One measures your backlog; the other measures a number that has been deliberately shaped for the HPA’s arithmetic.
Kubernetes Events are garbage-collected within the hour, which makes them useless for audit and for “what changed at 03:12”. CloudEventSource tells KEDA to emit its resource-lifecycle events as CloudEvents to an HTTP endpoint (or an Azure Event Grid topic) as well:
apiVersion: eventing.keda.sh/v1alpha1kind: CloudEventSourcemetadata: name: keda-audit namespace: labspec: clusterName: prod-eu-1 # appears in the event payload destination: http: uri: http://event-collector.observability.svc.cluster.local:8080/keda eventSubscription: includedEventTypes: # omit for the default set - keda.scaledobject.failed.v1 - keda.scaledobject.ready.v1
Practical notes:
Event types are a fixed enumeration covering resource lifecycle — ScaledObject and ScaledJob ready / failed / removed / paused / unpaused, ScaledJob rollout cleanup, and TriggerAuthentication changes. It is not a stream of every scale-up decision, so it does not replace metrics.
eventSubscription takes includedEventTypesorexcludedEventTypes; with neither, KEDA sends its default set — which is a subset of the full enumeration (the authentication-related types are valid to name explicitly but are not in the default set). If you care about a specific type, list it.
There is a cluster-scoped sibling, ClusterCloudEventSource, for one destination covering every namespace.
Good destinations: an Alertmanager webhook receiver, a Slack relay, a CloudEvents-aware audit sink, or a small function that annotates your deploy timeline. keda.scaledobject.failed.v1 in particular is a much better paging signal than scraping logs.
8. Alternatives — how to observe an autoscaled consumer
Approach
What it’s good at
What it can’t do
Choose it when
KEDA’s Prometheus metrics
KEDA’s own health, per-scaler errors, and exactly what number the HPA received
tell you real backlog — the Kafka value is clamped; needs the Helm flag enabled
always, as your KEDA-health layer — but never as your backlog SLI
Dedicated Kafka lag exporter
true per-partition, per-group lag with no clamping and no dependency on KEDA
say anything about whether KEDA is working
always, as your backlog SLI and paging signal — this is the alert that matters
kubectl inspection (the §1 drill)
fastest possible root-cause isolation; needs zero infrastructure; sees conditions and events metrics don’t expose
history — conditions are current-state and Events expire within the hour
live incidents and development; it is the primary debugging tool, not a monitoring system
CloudEventSource
durable, off-cluster audit trail of resource-lifecycle changes; drives automation
numeric time series; per-scale-decision detail
you need audit, change correlation, or to trigger automation on scaledobject.failed
They are layers, not options. A production setup runs all four: lag exporter for the SLI, KEDA metrics for KEDA’s health, kubectl for the drill, CloudEvents for the paper trail.
Try it
09 - LAB 3 — Break It on Purpose deliberately breaks each hop in the §1 path — kills the metrics server, mismatches offsetResetPolicy, stops the consumer committing — so you can run the drill against a fault you already know the answer to. That’s the only way the order becomes reflex.
9. Questions you should be able to answer
Your ScaledObject is Ready=True and Active=False with zero pods. Broken? (No — that’s the correct idle state of a scale-to-zero workload. Check whether lag is actually above activationLagThreshold.)
kubectl get hpa shows <unknown>/100. What does that tell you? (The metric could not be fetched at all — the path is broken. It does not mean lag is zero; that would render as 0/100.)
What’s the single most decisive command when scaling isn’t happening? (kubectl get --raw against external.metrics.k8s.io with the scaledobject.keda.sh/name label selector — it asks exactly what the HPA asks.)
Where do you get the metric name for that query? (From .status.externalMetricNames on the ScaledObject. Never type it by hand.)
Why must you never alert on keda_scaler_metrics_value for a Kafka trigger? (It’s clamped at partitions × lagThreshold by design, so it flatlines and looks healthy during a real backlog.)
You enabled Prometheus and see no keda_ series at all. First thing to check? (The Helm chart defaults prometheus.operator.enabled to false even though the binary defaults the flag to true.)
Which KEDA Grafana dashboard ID do you import? (None — there is no KEDA dashboard on grafana.com. Paste the first-party JSON from config/grafana/keda-dashboard.json in the KEDA repo.)
A ScaledObject looks perfectly healthy but nothing has scaled in weeks. (Check the PAUSED column — a paused annotation, with any value at all, suspends scaling silently.)
Lag is climbing, pods are at max, Kafka is idle. Where do you look? (kafka-consumer-groups.sh --describe twice — if CURRENT-OFFSET isn’t advancing, the consumer isn’t committing and it’s an application bug.)
What does Ready=False with reason HPAMetricsUnavailable mean? (New in v2.20: KEDA read its own HPA’s ScalingActive condition and is propagating a downstream metric-path failure.)