Scope
The timing knobs —
pollingInterval,cooldownPeriod,useCachedMetrics, the HPA’sbehaviorblock and its tolerance band — and, above all, which knob governs which transition. Almost every “KEDA won’t stop flapping” or “KEDA reacts too slowly” complaint is somebody turning a dial that has no authority over the thing they’re watching. Once you can name the owner of each transition, tuning becomes mechanical. Builds on the replica arithmetic in 07 - The Kafka Scaler — Every Field & the Replica Math and the ownership split in 03 - KEDA Architecture — Operator, Metrics Adapter & the HPA It Owns.
Related: KEDA & Kafka Autoscaling, 02 - Kafka Consumer Groups, Partitions & Rebalancing, 03 - KEDA Architecture — Operator, Metrics Adapter & the HPA It Owns, 04 - The ScaledObject CRD, End to End, 07 - The Kafka Scaler — Every Field & the Replica Math, 08 - Scale-to-Zero & Activation, 09 - LAB 3 — Break It on Purpose, 11 - Multiple Triggers, Scaling Modifiers & Fallback, 14 - Observability & Debugging — Why Isn’t It Scaling
Written against KEDA v2.20 · Kubernetes 1.33–1.35 · Apache Kafka 4.3
The
behaviorblock is passed straight through to a Kubernetesautoscaling/v2HPA, so its defaults are Kubernetes’ defaults, not KEDA’s — and they move with your cluster version, not your KEDA version. Thetolerancefield insidebehaviorneeds Kubernetes 1.33+ (feature gateHPAConfigurableTolerance); everything else here works on anyautoscaling/v2cluster.
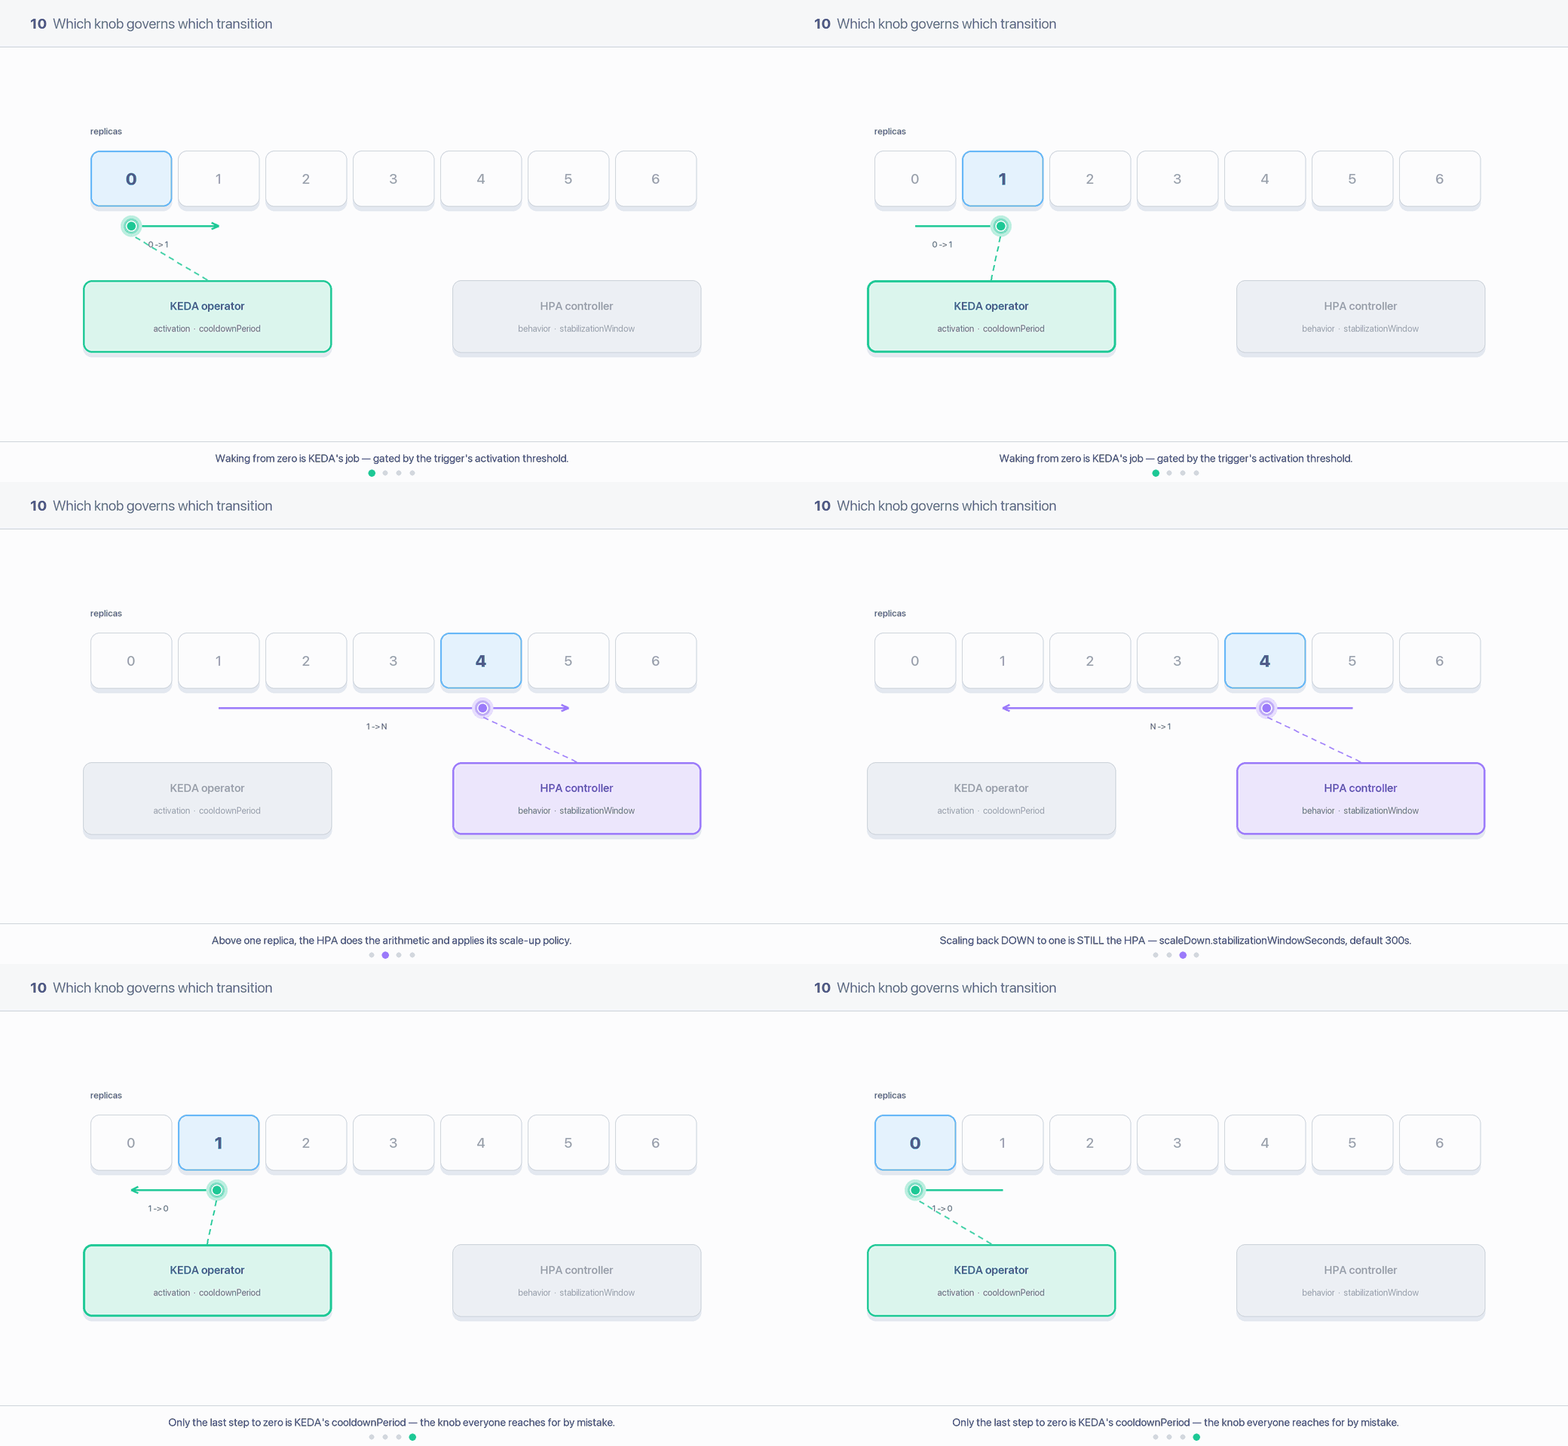
1. Which knob governs which transition
Lead with this. It is the whole module.
| Transition | Who decides | The knob that governs it | The knob that does nothing |
|---|---|---|---|
| 0 → 1 | KEDA operator, writing the scale subresource directly | the trigger’s activation threshold (Kafka: activationLagThreshold) + pollingInterval | behavior.scaleUp.* — the HPA isn’t involved yet |
| 1 → N (scale out) | the HPA controller | behavior.scaleUp.stabilizationWindowSeconds, scaleUp.policies, tolerance, lagThreshold | pollingInterval, cooldownPeriod |
| N → 1 (ordinary scale in) | the HPA controller | behavior.scaleDown.stabilizationWindowSeconds, scaleDown.policies, tolerance, lagThreshold | cooldownPeriod |
| 1 → 0 | KEDA operator, writing the scale subresource directly | cooldownPeriod (+ initialCooldownPeriod) | behavior.scaleDown.* |
Read the last two rows again, because they are the confusion this module exists to kill.
cooldownPerioddoes nothing for ordinary scale-downKEDA’s docs say it plainly: “the KEDA
cooldownPeriodonly applies when scaling to 0; scaling from 1 to N replicas is handled by the Kubernetes Horizontal Pod Autoscaler.”So if your workload flaps between 4 and 6 pods,
cooldownPeriodis the wrong dial — it is not consulted at any point in that transition. You want the HPA’sscaleDown.stabilizationWindowSeconds. RaisingcooldownPeriodfrom 300 to 900 in that situation changes exactly one thing: how long an idle workload waits before dropping to zero. The flapping continues, and you now believe you’ve tried something.
The diagnostic question is always the same: which two numbers is it flapping between? If one of them is 0, you’re in KEDA’s territory. If neither is 0, you’re in the HPA’s territory and should be editing advanced.horizontalPodAutoscalerConfig.behavior.
# Who is actually making the decision? Look at both sides.
kubectl describe scaledobject orders-consumer      # KEDA's view: Active / Ready / Fallback conditions
kubectl describe hpa keda-hpa-orders-consumer      # the HPA's view: events say "New size: N; reason: ..."
The HPA’s event stream is the honest record for anything above 1 replica. If kubectl describe hpa shows the resize events, KEDA’s knobs are irrelevant to what you’re looking at.
2. pollingInterval — how often KEDA asks Kafka
spec:
  pollingInterval: 30      # seconds. Default 30. Minimum 1.
Every pollingInterval, the operator queries each trigger once and records two things: the metric value, and an activation boolean. That’s it. It is the cadence of KEDA’s own loop.
The trade-off is reaction speed against load on your event source. Halving it halves your worst-case detection delay for a 0 → 1 wake-up, and doubles the number of OffsetFetch + ListOffsets round-trips your brokers serve for that ScaledObject, forever, whether or not anything is happening.
The HPA reads on its own clock, not yours
The HPA controller re-evaluates its metrics roughly every 15 seconds (
--horizontal-pod-autoscaler-sync-periodon the kube-controller-manager, default15s), completely independently ofpollingInterval. Those two loops are unsynchronised.Two consequences. First, the value the HPA acts on can be up to one full
pollingIntervalstale — with the default 30 s, the HPA may be dividing a number that describes the world half a minute ago. Second, by default a fresh HPA read does cause a fresh scaler query, so a 15 s HPA cycle queries Kafka more often than your 30 spollingIntervalsuggests. Fixing that second point is whatuseCachedMetricsis for (§3).
Practical sizing. pollingInterval matters most when you’re at zero replicas, because then it is the only thing standing between an arriving message and a running pod. At 1+ replicas it mostly governs metric freshness. Going below ~10 s is rarely worth it: you pay broker load continuously to shave a few seconds off a transition that then has to wait for a pod to schedule, pull an image, join the consumer group and trigger a rebalance anyway.
3. useCachedMetrics — the fix for “KEDA is hammering my brokers”
  triggers:
  - type: kafka
    useCachedMetrics: true       # per-trigger. Default false.
    metadata: { ... }
By default the read path is pull-through: the HPA asks the Kubernetes metrics API, that lands on KEDA’s metrics adapter, and the adapter asks the operator, which asks Kafka. Every 15 seconds. Per ScaledObject. Plus KEDA’s own polling loop on top.
With useCachedMetrics: true, KEDA’s polling loop writes each result into a small in-memory cache, and the HPA’s read is served from that cache without touching the scaler at all. The event source is then queried on KEDA’s polling cycle only. On a cluster with a few hundred Kafka-backed ScaledObjects that is the difference between a constant background metadata load on your brokers and a negligible one.
default (false) | useCachedMetrics: true | |
|---|---|---|
| Kafka queried on KEDA’s polling loop | ✓ | ✓ |
| Kafka queried again on every HPA sync (~15 s) | ✓ | ✗ |
| Worst-case metric staleness at the HPA | ~1 HPA sync | up to one pollingInterval |
The trade-off is staleness, and it is the same staleness pollingInterval already imposes — you’re choosing to always pay it rather than sometimes getting a fresher number by accident. If that bothers you, lower pollingInterval; the point of caching is that lowering it is now cheap, because the polling loop is the only querier.
Gotcha — not available for
cpu,memoryorcrontriggersSetting
useCachedMetrics: trueon acpu,memoryorcrontrigger is rejected by the admission webhook, so a ScaledObject that mixes a cached Kafka trigger with a CPU safety-net trigger will fail to apply if you set the flag in the wrong place. It makes sense once you know that cpu/memory metrics never travel through KEDA at all — the HPA reads them straight from the Metrics Server.
Mitigation: setuseCachedMetricsper-trigger on the event-source triggers only. Never at the spec level, where it doesn’t exist anyway.
Best practice
Turn it on for every Kafka trigger in a cluster with more than a handful of ScaledObjects. Leave it off while you’re actively debugging a scaling problem — a cached metric makes
kubectl get --rawoutput lag behind reality and adds a confusing variable (14 - Observability & Debugging — Why Isn’t It Scaling).
4. The HPA behavior block — and why its defaults surprise everyone
Anything you put under advanced.horizontalPodAutoscalerConfig.behavior is copied verbatim onto the HPA KEDA generates. It is the only way to influence 1 ↔ N timing from a ScaledObject.
Kubernetes merges what you specify with its own defaults. Those defaults are:
behavior:
  scaleDown:
    stabilizationWindowSeconds: 300        # five minutes of hesitation
    policies:
    - type: Percent
      value: 100
      periodSeconds: 15
  scaleUp:
    stabilizationWindowSeconds: 0          # none. Immediate.
    policies:
    - type: Percent
      value: 100
      periodSeconds: 15
    - type: Pods
      value: 4
      periodSeconds: 15
    selectPolicy: Max
Kubernetes is deliberately eager to scale up and reluctant to scale down
Scale-up has no stabilisation window at all. The moment a metric says “more pods”, pods appear — up to a doubling or four extra pods every 15 seconds, whichever is larger (
selectPolicy: Max).
Scale-down has a 300-second window. The controller looks back over the last five minutes of computed desired-replica values and “uses the highest value from the specified interval” — a rolling maximum. So you only shrink once the workload has looked genuinely over-provisioned for five continuous minutes.This asymmetry is intentional and usually correct: being slow to add capacity costs you an SLO, being slow to remove it costs you money. But it means the flapping people report is almost always scale-up flapping, and the default config has nothing damping it.
A worked block, tuning both directions
spec:
  advanced:
    horizontalPodAutoscalerConfig:
      behavior:
        scaleUp:
          stabilizationWindowSeconds: 60   # k8s default is 0 — require a sustained signal
          policies:
          - type: Pods
            value: 2                       # at most +2 pods per 30s = 2 rebalances, not 4
            periodSeconds: 30
          selectPolicy: Max
        scaleDown:
          stabilizationWindowSeconds: 600  # be extra reluctant: rebalances are expensive
          policies:
          - type: Pods
            value: 1                       # remove one pod at a time
            periodSeconds: 60
          selectPolicy: Min                # when in doubt, take the gentler policy
Reading it field by field:
stabilizationWindowSeconds— how far back the controller looks before acting. Up: a rolling minimum of recent recommendations, so a single spiky reading can’t add pods. Down: a rolling maximum, so a momentary lull can’t remove them.policies— rate limits on the size of each step.type: Podsis an absolute count;type: Percentis a fraction of current replicas.periodSecondsis the window the limit applies over (maximum1800).PodsvsPercent—Percentscales its own aggressiveness with the workload, which is what you want on a Deployment that ranges from 3 to 300 pods.Podsgives a predictable, auditable step, which is what you want when each step costs a Kafka rebalance and you’re budgeting rebalances. For Kafka consumers, preferPods.selectPolicy—Max(the default) picks whichever policy permits the biggest change;Minpicks the most conservative;Disabledturns off that direction entirely.
Committed recommendation for Kafka consumers
Set
scaleUp.stabilizationWindowSecondsto 60 and cap scale-up with aPodspolicy rather than leaving the default 100%-plus-4-pods behaviour. LeavescaleDownat the 300 s default unless you’ve measured that it’s hurting you. This single change removes most autoscaling-induced rebalance churn on a Kafka workload, and it costs you one minute of reaction time on a genuine burst.
5. The tolerance band — why small thresholds feel twitchy and large ones feel dead
Before the HPA acts on a metric, it checks whether the change is big enough to be worth acting on. It computes a ratio of observed usage to the target, and ignores anything within ±10% by default. That 10% is a cluster-wide setting (--horizontal-pod-autoscaler-tolerance on the kube-controller-manager); from Kubernetes 1.33+ you can also override it per-direction inside behavior with a tolerance field.
The crucial word is relative. The dead band is a percentage of the target, and the target is lagThreshold × replicas. So the band’s size in messages is a consequence of lagThreshold:
lagThreshold | replicas | effective target | ±10% dead band | practical feel |
|---|---|---|---|---|
10 | 4 | 40 messages | ±4 messages | twitchy — normal jitter crosses it constantly |
1000 | 4 | 4,000 messages | ±400 messages | calm, responds to real trends |
50000 | 4 | 200,000 messages | ±20,000 messages | feels broken — nothing you do moves it |
That’s the whole phenomenon. A tiny lagThreshold makes every handful of messages a scaling event; an enormous one means the workload appears frozen because a backlog you consider alarming is still inside the band. Neither is a KEDA bug — the number you chose defined the sensitivity.
6. How to size lagThreshold properly
The recipe, and it is genuinely just measurement:
lagThreshold= the number of messages one pod clears in onepollingInterval.
Get that right and one unit of the metric means “one pod’s worth of work”, the HPA’s ceil(totalLag / lagThreshold) becomes “how many pods would clear this backlog in one interval”, and the tolerance band lands somewhere sensible on its own.
Worked example. Measure committed-offset progress on a running consumer, twice, sixty seconds apart:
kubectl exec -it kafka-0 -- bin/kafka-consumer-groups.sh \
  --bootstrap-server localhost:9092 --describe --group orders-processor
# note the sum of CURRENT-OFFSET across partitions, wait 60s, repeat
Say the sum advanced by 5,400 offsets in 60 seconds with 3 pods running and no lag building up:
- 5,400 ÷ 60 s = 90 messages/second for the group
- ÷ 3 pods = 30 messages/second per pod
- × 30 s
pollingInterval= 900 messages per pod per interval - →
lagThreshold: "1000"(round to something legible; precision here is false comfort)
Sanity-check the shape it produces. With lagThreshold: 1000, a 12-partition topic and maxReplicaCount: 12: lag 1,000 → 1 pod, 4,500 → 5 pods, 12,000+ → 12 pods and capped. A steady 4-pod state has a ±400-message dead band. All of that is legible and defensible, which is exactly what you want when someone asks why the number is what it is.
Re-measure after you change the consumer
Throughput per pod is a property of your code and its downstreams, not of Kafka. A new enrichment call, a slower database, a bigger
max.poll.records— any of them invalidate the measurement. TreatlagThresholdas a tuned constant with a comment recording how it was derived, and revisit it when per-message work changes.
7. Recommended starting points
Committed numbers. Start here, then measure and adjust — but start here, not at the defaults.
| Latency-sensitive (user-facing, must not queue) | Throughput / batch (cost-optimised, backlog is fine) | Spiky with scale-to-zero (idle most of the day) | |
|---|---|---|---|
minReplicaCount | 2 | 1 | 0 |
pollingInterval | 10 | 30 (default) | 15 |
cooldownPeriod | irrelevant — never reaches 0 | irrelevant — never reaches 0 | 300 (default), 600 if wake-up is expensive |
scaleUp.stabilizationWindowSeconds | 0 (accept the churn) | 120 | 30 |
scaleUp policy | Percent 100 / 15s (default) | Pods 2 / 60s | Pods 4 / 30s |
scaleDown.stabilizationWindowSeconds | 300 (default) | 900 | 300 (default) |
scaleDown policy | Pods 1 / 60s | Pods 1 / 120s | Percent 100 / 15s (default) |
lagThreshold | ~5–10 s of one pod’s work | one pod’s work per pollingInterval | one pod’s work per pollingInterval |
The reasoning, profile by profile.
Latency-sensitive. You are buying reaction time with money and rebalances. minReplicaCount: 2 means you never pay a cold start and never depend on activation logic. A short pollingInterval keeps the metric fresh. Keep scale-up instant, and make lagThreshold a fraction of a polling interval’s work so a modest queue already demands a pod — you’re targeting queue time, not queue depth. Scale down one pod at a time so a burst that’s still arriving doesn’t get its capacity yanked.
Throughput / batch. Backlog is not an incident, so buy stability instead. A two-minute scale-up window filters out every spike that would resolve itself; Pods 2 / 60s bounds you to two rebalances a minute at worst. A 15-minute scale-down window means you keep warm consumers through the gaps between batches. Defaults everywhere else.
Spiky with scale-to-zero. Here pollingInterval is load-bearing: at zero replicas it is your reaction time, so 15 s. cooldownPeriod is finally doing something real — 300 s of quiet before shutting off, raised to 600 if starting a pod is slow or a rebalance is painful. A short scale-up window plus a generous Pods step lets the first burst ramp quickly, because a workload that was at zero is by definition behind.
8. The gotchas that cause real incidents
Gotcha — tuning
cooldownPeriodto fix N → 1 flappingThe single most common misconfiguration in KEDA. The workload oscillates between 4 and 6 pods, somebody raises
cooldownPeriodto 900, nothing changes, and the conclusion drawn is “KEDA’s cooldown is broken.” It isn’t consulted:cooldownPeriodgates only the final step to zero (or toidleReplicaCount).
Mitigation: if neither end of the oscillation is0, editadvanced.horizontalPodAutoscalerConfig.behavior.scaleDown.stabilizationWindowSeconds. Confirm the diagnosis first withkubectl describe hpa keda-hpa-<name>— if the resize events are there, it’s the HPA’s decision and only HPA knobs can change it.
Gotcha — every scale event costs a Kafka rebalance, so aggressive scaling has a throughput cost
Adding a consumer to a group triggers a rebalance, and with Kafka’s out-of-the-box assignor that is stop-the-world: every member gives up its partitions before any are reassigned. The HPA’s default scale-up policy permits doubling, or +4 pods, every 15 seconds — potentially several group-wide pauses per minute, precisely while you are behind and least able to afford them. Autoscaling can genuinely make a backlog worse.
Mitigation: treat rebalances as a budget. Add ascaleUpstabilisation window, cap steps with aPodspolicy, and if your brokers are Kafka 4.0+ set the consumer’sgroup.protocol=consumer(KIP-848) so rebalancing no longer needs a global barrier at all — see 02 - Kafka Consumer Groups, Partitions & Rebalancing.
Gotcha —
pollingInterval: 1to "make it snappy"Every poll is a metadata plus offset round-trip to your brokers, per ScaledObject, forever. A hundred consumers at
pollingInterval: 1is a hundred queries a second of pure autoscaling overhead landing on the same cluster you’re trying to keep healthy, and it buys you almost nothing: pod scheduling, image pull, group join and rebalance dominate the actual 0 → 1 latency.
Mitigation: floor at ~10 s. If the real motivation was reducing broker load rather than reaction time,useCachedMetrics: trueis the direct fix and leavespollingIntervalfree to be low.
Gotcha — expecting instant reaction from a metric that is up to one interval stale
KEDA polls on its own clock; the HPA reads on its own clock; the two are unsynchronised. With defaults, the number the HPA divides can describe Kafka as it was 30 seconds ago — and with
useCachedMetrics: truethat becomes the guaranteed worst case rather than an occasional one. People then measure “time from burst to first new pod”, find it exceeds their expectation, and go looking for a bug.
Mitigation: budget for it explicitly. Worst-case reaction ≈pollingInterval+ one HPA sync (~15 s) +scaleUp.stabilizationWindowSeconds+ pod start-up + rebalance. Write that sum down before promising anyone a number, and lowerpollingIntervalif the sum doesn’t fit your SLO.
Gotcha — KEDA will tell you your timing knobs are irrelevant, in a warning nobody reads
Since v2.20 the admission webhook emits non-blocking warnings on apply:
PollingInterval is configured but is not relevant. PollingInterval is only relevant when minReplicaCount = 0 or idleReplicaCount = 0 or useCachedMetrics is enabled, and the equivalent forCooldownPeriod. The object is accepted —kubectl applysucceeds — so a carefully tunedpollingInterval: 5on aminReplicaCount: 3ScaledObject sits there doing nothing while the warning scrolls past.
Mitigation: read the output ofkubectl apply, don’t just check the exit code. If you’re not scaling to zero and not using cached metrics,pollingIntervalandcooldownPeriodare decoration — spend your tuning effort onbehaviorandlagThresholdinstead.
Gotcha — the webhook's
failurePolicyisIgnoreby defaultKEDA’s validating webhook ships with
failurePolicy: Ignore, so if the webhook pod is unavailable your ScaledObject is admitted unvalidated — no warnings, no rejections. A config you believe was checked may never have been.
Mitigation: in production, install withwebhooks.failurePolicy=Fail, and verify a config change actually produced the events you expected rather than assuming silence means success.
9. Alternatives — four ways to damp a twitchy workload
They are not interchangeable. Each pays for calm with something different.
| Approach | What it costs you | Choose it when |
|---|---|---|
HPA stabilisation window (behavior.*.stabilizationWindowSeconds) | reaction latency, in that direction only | the default choice. You want the pod count to move on sustained signal, per-direction, without touching the metric’s meaning. Fixes scale-up flapping specifically, which is what the defaults leave exposed. |
HPA policies (Pods / Percent + periodSeconds) | how fast you can reach the right size | the size of each step is the problem, not its frequency — you want a rebalance budget, or you need to avoid slamming the Cluster Autoscaler with a doubling request. Combine with a window; they solve different halves. |
Raise lagThreshold | the metric now means something different, and the tolerance band widens proportionally | the threshold was never derived from measurement. This is a correction, not a damper — do the §6 measurement and set the right value rather than inflating it until the noise stops, or you’ll silently under-provision. |
Raise pollingInterval | metric freshness, and 0 → 1 reaction time | broker load is the actual complaint, or your event source is rate-limited. As a damper it’s the bluntest option and it degrades scale-from-zero. Prefer useCachedMetrics: true, which cuts source load without slowing the polling loop. |
The order to try them in
Measure
lagThresholdproperly → add ascaleUpstabilisation window → cap step size with aPodspolicy → only then touchpollingInterval. Going in the reverse order is how workloads end up slow and twitchy.
10. Questions you should be able to answer
- Your consumer oscillates between 4 and 6 pods. Which field do you change? (
behavior.scaleDown.stabilizationWindowSeconds— the HPA owns N → 1.cooldownPeriodis not involved.) - What does
cooldownPeriodactually govern? (Only the final transition to 0 oridleReplicaCount, measured from the last time a trigger was active.) - Kubernetes’ default scale-up stabilisation window is what, and why does it matter? (Zero — scale-up is immediate by design, which is why flapping is almost always upward and why Kafka workloads need a window added.)
- KEDA polls every 30 s. How stale can the number the HPA divides be? (Up to one full
pollingInterval; the two loops are unsynchronised, anduseCachedMetricsmakes that the guaranteed worst case.) - Your brokers are drowning in KEDA metadata requests. Cheapest fix? (
useCachedMetrics: trueper trigger — the HPA reads a cached value instead of triggering a fresh query on every ~15 s sync.) - Why does
lagThreshold: 1feel twitchy andlagThreshold: 50000feel dead? (The HPA’s ~10% tolerance is relative tolagThreshold × replicas, so the threshold sets the size of the dead band in messages.) - How do you derive
lagThreshold? (Measure committed-offset progress per pod, multiply bypollingInterval— one metric unit then equals one pod’s worth of work.) - Why isn’t aggressive scale-up free on Kafka? (Each added consumer triggers a rebalance; the default policy allows doubling or +4 pods every 15 s, so several group-wide pauses per minute exactly when you’re behind.)
- You set
pollingInterval: 5and nothing changed. Why? (minReplicaCount ≥ 1and no cached metrics — KEDA warns on apply that it’s irrelevant, non-blockingly.)
11. Sources
- KEDA — ScaledObject specification (
pollingInterval,cooldownPeriod,initialCooldownPeriod,advanced.horizontalPodAutoscalerConfig) - KEDA — Scaling Deployments: caching metrics, activating vs scaling
- KEDA — Apache Kafka scaler (
lagThreshold,activationLagThreshold) - KEDA — admission webhooks
- Kubernetes — HorizontalPodAutoscaler walkthrough: scaling policies, stabilisation window, tolerance, default behavior
- Kubernetes — HorizontalPodAutoscaler v2 API reference (
behavior) - Kubernetes — kube-controller-manager options (
--horizontal-pod-autoscaler-sync-period,--horizontal-pod-autoscaler-tolerance) - Apache Kafka — the new consumer rebalance protocol (KIP-848),
group.protocol - KIP-429 — incremental cooperative rebalancing and the “stop-the-world” cost