Scope
The Kafka trigger, end to end: which of KEDA’s two Kafka scalers to use, what every field does, and how consumer lag actually turns into a pod count. The one idea to take away is that KEDA doesn’t decide your replica count — it reports a number, and the HPA divides. Once you can do that arithmetic in your head, you can predict and debug any Kafka autoscaling config. Builds on 02 - Kafka Consumer Groups, Partitions & Rebalancing; the ownership split it relies on is in 03 - KEDA Architecture — Operator, Metrics Adapter & the HPA It Owns.
Related: KEDA & Kafka Autoscaling, 02 - Kafka Consumer Groups, Partitions & Rebalancing, 03 - KEDA Architecture — Operator, Metrics Adapter & the HPA It Owns, 08 - Scale-to-Zero & Activation, 10 - Tuning Scaling Behaviour, 12 - Authentication — TriggerAuthentication, SASL, TLS & MSK IAM
Written against KEDA v2.20 · Kubernetes 1.33–1.35 · Apache Kafka 4.3
KEDA’s CRDs are still
v1alpha1and the project has said they will stay there, which means breaking changes arrive in minor releases. Pin your KEDA version and skim the release notes before upgrading. Field names and defaults below are current for v2.20 — re-check them against the scaler docs for whatever version you actually run.
1. How lag becomes a pod count
Every pollingInterval (default 30 s), KEDA asks your Kafka brokers two questions per partition: where has this consumer group committed to? and where does the log end? The difference is lag. KEDA adds up the lag across all partitions, and publishes that single total as a metric.
Then the HPA — not KEDA — does the division:
replicas = ceil( totalLag / lagThreshold )
That’s the whole model. lagThreshold is “how much backlog one pod should be responsible for.” If lag is 900 and lagThreshold is 100, you get 9 pods. Drain to 250 and you get 3.
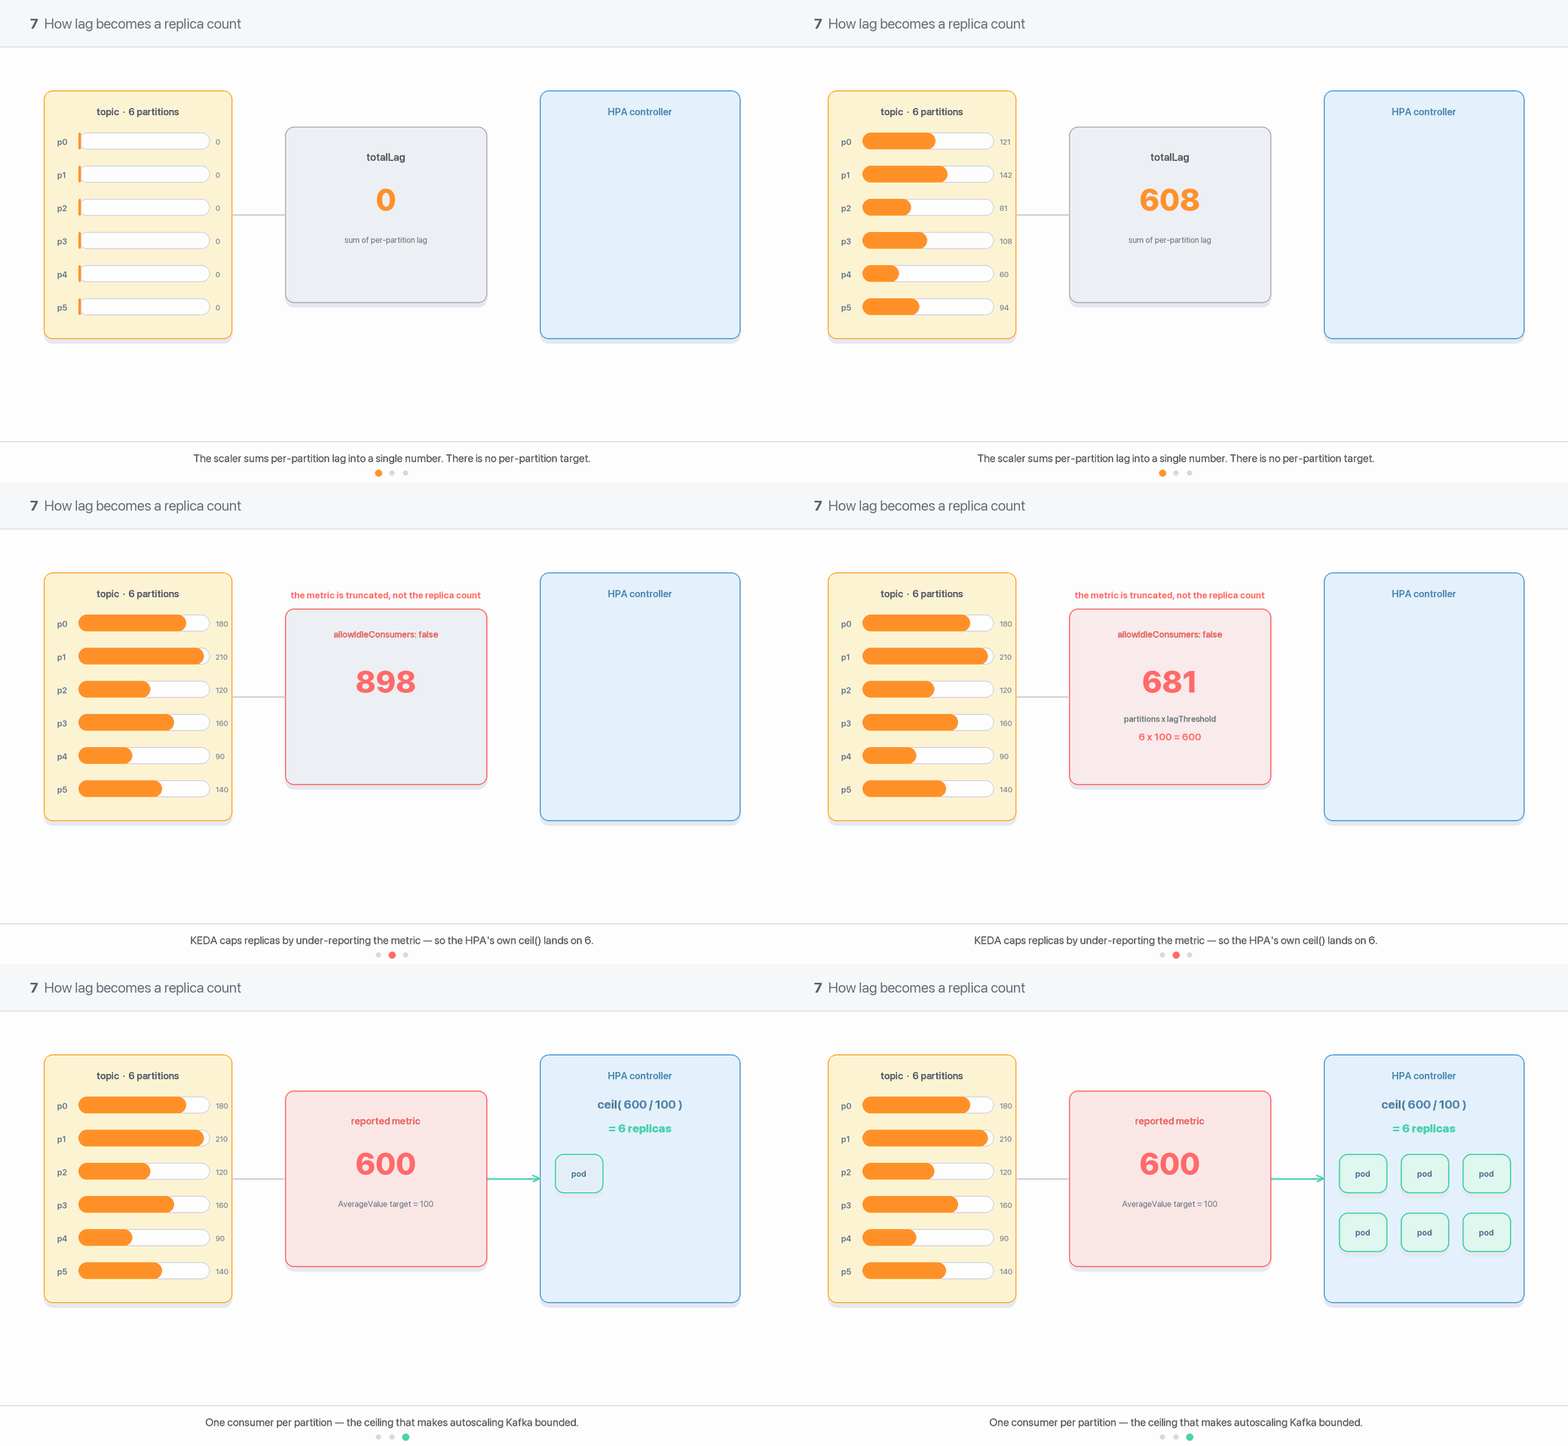
Two consequences fall out of this immediately, and both matter more than they first appear:
KEDA sees one number, not a shape. One hot partition with 10,000 messages behind and a hundred balanced partitions with 100 each produce the same total and the same pod count. But only the second case can actually use those pods.
So a skewed topic can’t be fixed by autoscaling. If one partition is hot because of a bad partition key, adding consumers achieves nothing — that partition still has exactly one owner (see 02 - Kafka Consumer Groups, Partitions & Rebalancing). The fix lives in the producer’s choice of key. Autoscaling amplifies good partitioning; it can’t rescue bad partitioning.
The one-liner worth remembering
KEDA’s Kafka scaler is a metric source, not an autoscaler. It reports total consumer-group lag; the HPA turns that into replicas; KEDA only takes over at the edge the HPA can’t handle — going to and from zero (08 - Scale-to-Zero & Activation).
2. There are two Kafka scalers, and the docs make it confusing
Before writing any YAML, know that KEDA ships two Kafka triggers.
type: kafka | type: apache-kafka | |
|---|---|---|
| Status | stable, since KEDA v1.0 | Experimental, since v2.12 |
| Maintained by | Microsoft | community |
| Multiple topics in one trigger | ✗ one topic only | ✓ comma-separated list |
| OAuth / Kerberos auth | ✓ | ✗ |
| AWS MSK IAM | ✓ | ✓ |
Gotcha — the doc page name doesn't match the trigger name
The page at
keda.sh/docs/2.20/scalers/apache-kafka/documentstype: **kafka**. The trigger actually calledapache-kafkais documented at/scalers/apache-kafka-go/. So the natural assumption — “the page named apache-kafka describes the trigger named apache-kafka” — is wrong. People copytype: apache-kafkafrom a page describing the other scaler’s fields, then hit validation errors that make no sense, because the two don’t accept the same fields.
Mitigation: choose by trigger type and check you’re on the matching page. Writingtype: kafka? Read/scalers/apache-kafka/.
Use
type: kafka— the committed recommendationIt’s stable, vendor-maintained, and has complete authentication support. The experimental one was introduced in v2.12 as an eventual replacement, but eight releases later it’s still labelled Experimental, and neither is deprecated. Its Kerberos support is a particular trap: the config validates but then fails when the scaler actually tries to connect, because the underlying library doesn’t implement it.
Reach forapache-kafkaonly if you genuinely need several topics in a single trigger — a real capability the stable scaler lacks.
3. The fields you’ll actually use
A working trigger needs only four things:
triggers:
- type: kafka
  metadata:
    bootstrapServers: kafka-0.kafka.lab.svc.cluster.local:9092
    consumerGroup: orders-workers
    topic: orders
    lagThreshold: "500"
Everything else is tuning. Here’s the full set, grouped by what it’s for.
The essentials
| Field | Default | What it does |
|---|---|---|
bootstrapServers | required | comma-separated broker list |
consumerGroup | required | whose lag to measure |
topic | optional | which topic. Leaving it out has surprising effects — see §5 |
lagThreshold | 10 | backlog per pod. The main dial you turn |
Controlling how far it scales
| Field | Default | What it does |
|---|---|---|
allowIdleConsumers | false | false stops KEDA scaling past the partition count (§4) |
limitToPartitionsWithLag | false | cap at partitions that currently have lag, not all of them |
ensureEvenDistributionOfPartitions | false | only scale to pod counts that divide the partitions evenly |
partitionLimitation | all | watch only a subset of partitions, e.g. "1,2,10" |
Handling awkward lag
| Field | Default | What it does |
|---|---|---|
activationLagThreshold | 0 | how much lag wakes the workload from zero (08 - Scale-to-Zero & Activation) |
offsetResetPolicy | latest | how to count lag on a partition with no committed offset |
excludePersistentLag | false | ignore partitions whose offset isn’t moving |
scaleToZeroOnInvalidOffset | false | treat “no committed offset” as zero lag rather than some lag |
Connecting securely — tls, sasl, unsafeSsl, saslTokenProvider, awsRegion, plus credentials supplied through a TriggerAuthentication. All covered in 12 - Authentication — TriggerAuthentication, SASL, TLS & MSK IAM.
Gotcha — two fields that don't exist
excludeIdlePartitionsandtopicPartitionRebalanceshow up in blog posts and AI-generated configs. Neither is real. What people usually want islimitToPartitionsWithLag(cap pods at the number of partitions with actual backlog) orexcludePersistentLag(ignore stalled partitions).
Mitigation: check any field name against the scaler docs for your KEDA version before assuming a feature is broken.
4. The partition ceiling — and why your dashboard will look wrong
Kafka gives each partition to exactly one consumer in a group. So pods beyond the partition count join, get nothing assigned, and idle. A 12-partition topic has a natural ceiling of 12 useful consumers no matter how much backlog you have.
KEDA respects this by default (allowIdleConsumers: false). But how it does so surprises people, and it’s worth understanding because it shows up in your monitoring.
KEDA doesn’t cap the pod count. It caps the number it reports. When true lag implies more pods than there are partitions, KEDA reports partitions × lagThreshold instead of the real total — a number chosen precisely so the HPA’s own division lands on the partition count.
Your KEDA metric will disagree with
kafka-consumer-groups.sh, on purposeReal lag of 90,000 on a 12-partition topic with
lagThreshold: 500gets reported as 6,000 (12 × 500), and it stops moving no matter how far behind you fall. That is not a stuck exporter and not a bug. It means you cannot use KEDA’s reported metric as your lag alert — it’s capped by design and will look healthy during a genuine backlog emergency. Alert on lag from Kafka itself, or from a dedicated lag exporter. See 14 - Observability & Debugging — Why Isn’t It Scaling.
When to change the ceiling. Leave allowIdleConsumers: false — it’s the right default and it’s doing real work. There’s essentially one good reason to set it true: your consumer isn’t a plain group member (it assigns partitions manually, or each pod runs several consumer instances internally), so the partition count doesn’t describe your real parallelism.
limitToPartitionsWithLag: true is the more useful knob. On a topic where traffic concentrates in a few partitions, it scales to the number of partitions with actual backlog — a 48-partition topic with lag on 3 partitions gives you 3 pods, not a march toward 48.
Even distribution. ensureEvenDistributionOfPartitions: true restricts the pod count to numbers that divide the partition count evenly, so nobody ends up with double their neighbour’s share. On 10 partitions with lagThreshold: 10 the ladder is 1 → 2 → 5 → 10.
Gotcha — even distribution on a prime partition count is a cliff
The allowed pod counts are the divisors of the partition count. A prime number has only two: 1 and itself. So a 13-partition topic can only run 1 pod or 13 pods — the moment lag crosses
lagThreshold, you jump straight from one to thirteen. A 12-partition topic gives you a comfortable 1, 2, 3, 4, 6, 12.
Mitigation: only enable this on a well-factored partition count. Better, pick partition counts with lots of divisors when you create the topic — 12, 24, 48 and 60 are excellent; 13, 17 and 31 are unusable here. This is a good reason to prefer 12 over 10 or 13 for a topic you intend to autoscale.
Best practice — set
maxReplicaCountto the partition count anywayEven though
allowIdleConsumers: falsealready handles it, pinmaxReplicaCountexplicitly. It costs nothing, it documents the intent where the next person will read it, and it’s your only protection if someone later flipsallowIdleConsumers: truewhile debugging something unrelated.
5. One topic, several topics, or none
Leaving topic out makes KEDA discover topics from the consumer group — and the two scalers do this very differently.
The stable kafka scaler looks at topics the group has actually committed offsets for. Reasonable. The experimental apache-kafka scaler instead walks every topic in the cluster, with no filter, and its own docs admit the feature is a work in progress.
Gotcha — omitting
topiconapache-kafkascales on your whole clusterEvery partition without a committed offset for your group contributes a little lag, so scanning the entire cluster produces a baseline that has nothing to do with your workload and never reaches zero. Worse, at zero replicas the group has no members, the scaler errors out, and the workload can’t scale back up — pinned at zero with a failing trigger.
Mitigation: always settopicexplicitly. Mandatory onapache-kafka, and good hygiene onkafkatoo — an explicit topic is self-documenting and immune to a stray committed offset from an unrelated deployment quietly widening your scaling signal.
When you have several topics, you have a genuine design choice:
| Approach | How the maths works | Choose it when |
|---|---|---|
| One trigger per topic | each trigger asks for pods; the HPA takes the highest | topics differ in volume or cost per message |
| One trigger, several topics | lag is summed, then divided once | topics are similar in volume and cost |
Gotcha — summing topics lets a busy one starve a quiet one
With topics summed into a single number, the high-volume topic dominates. A low-volume but latency-sensitive topic can sit with growing lag while the pod count is driven entirely by its noisy neighbour — and the extra pods may not even be assigned to the starving topic’s partitions.
Mitigation: use separate triggers when topics differ materially in throughput or per-message cost; the HPA’s take-the-highest rule then lets each topic demand pods on its own. If the workloads are genuinely different, give them different Deployments.
Gotcha — one broken trigger freezes scale-down for the whole workload
When the HPA can’t read one of its metrics and the others suggest scaling down, it skips scaling entirely. So a single unreachable Kafka cluster among your triggers doesn’t just stop that topic’s scaling — it pins the whole workload at its current size, paying for capacity indefinitely.
Mitigation: configurespec.fallbackso a scaler failure resolves to a defined pod count instead of an unreadable metric (11 - Multiple Triggers, Scaling Modifiers & Fallback), and alert on KEDA’s scaler error metrics.
6. The gotchas that cause real incidents
Alongside the ones above, these are what actually go wrong in production. Timing traps live in 10 - Tuning Scaling Behaviour; zero-related ones in 08 - Scale-to-Zero & Activation.
lagThreshold: 1makes the workload flapWith a tiny threshold, every few messages change the computed pod count. Scale-up is especially twitchy because Kubernetes applies no stabilisation delay to scale-up by default (only to scale-down). And since every scale event triggers a Kafka rebalance, flapping doesn’t just churn pods — it repeatedly pauses the whole consumer group.
Mitigation: setlagThresholdto roughly the number of messages one pod clears in onepollingInterval. Then one unit of the metric means “one pod’s worth of work” and the count moves in sensible steps. Add a scale-up stabilisation window on top (10 - Tuning Scaling Behaviour).
A consumer that doesn't commit looks permanently behind
KEDA reads committed offsets from the broker, not your consumer’s in-memory position. A consumer that processes messages but commits rarely — or has a bug in its commit path — shows lag that never falls. KEDA scales up; the new pods also don’t commit; lag keeps climbing. You hit
maxReplicaCountwith a perfectly healthy-looking consumer and an idle Kafka cluster.
Mitigation: check withkafka-consumer-groups.sh --describewhetherCURRENT-OFFSETis advancing. If it isn’t, it’s a consumer bug, not an autoscaling problem. Keep your commit interval well belowpollingIntervalso KEDA sees progress between polls.
Lag never reaches zero on transactional or compacted topics
Lag counts positions in the log, not messages you can consume. Kafka transactions write invisible commit markers that occupy offsets; log compaction removes messages but leaves their offsets valid; and an in-flight transaction can stop a
read_committedconsumer from reading to the end at all. The result is a permanent lag floor of roughly one per partition — so a workload that should idle at zero never quite gets there.
Mitigation: don’t setlagThresholdoractivationLagThresholdto 0 or 1 on such topics. SetactivationLagThresholdabove the idle floor — around the partition count is a good start. Measure it yourself: drain the topic completely and see what lag KEDA still reports.
Scale-down kills consumers mid-batch and the messages come back
Kubernetes gives a pod 30 seconds to exit by default, then kills it. A consumer holding a batch it has processed but not committed loses that commit, and after the rebalance those messages are delivered again to another pod. With non-idempotent processing, that’s duplicate side effects caused purely by autoscaling.
Mitigation: four things together — raiseterminationGracePeriodSecondsabove your worst-case batch time; handleSIGTERMto stop polling, finish the batch, commit, then close the consumer cleanly (which also triggers a faster rebalance); keep batches small; and make processing idempotent, because at-least-once delivery means you’ll reprocess sooner or later anyway. For genuinely long per-message work, use 13 - ScaledJob — When a Pod per Message Beats a Consumer Pool instead.
excludePersistentLagforgets everything when KEDA restartsThis flag ignores partitions whose offset hasn’t moved since the last check — the standard defence against a poison message wedging a consumer and driving endless scale-up. But KEDA holds the comparison baseline in memory, so after any operator restart (upgrade, eviction, node drain) the first check has nothing to compare against and reports full lag once — which can spike your pod count.
Mitigation: treat it as a damper, not a cure. The real fix for a poison message is a dead-letter queue in the consumer, so processing always moves the offset forward. Pair the flag with a scale-up stabilisation window so one post-restart reading can’t spike you.
7. Putting it together
A config for a 12-partition topic whose consumer clears roughly 500 messages every 30 seconds:
apiVersion: keda.sh/v1alpha1
kind: ScaledObject
metadata:
  name: orders-consumer            # keep it short: "keda-hpa-" + this must fit in 63 chars
spec:
  scaleTargetRef:
    name: orders-consumer
  pollingInterval: 30              # how often KEDA asks Kafka
  cooldownPeriod: 300              # only governs the final step down to zero
  minReplicaCount: 0
  maxReplicaCount: 12              # = partition count, stated on purpose
  fallback:
    failureThreshold: 3            # ride out a brief broker outage
    replicas: 4
    behavior: currentReplicasIfHigher
  advanced:
    horizontalPodAutoscalerConfig:
      behavior:
        scaleUp:
          stabilizationWindowSeconds: 60    # Kubernetes default is 0 — damp the flapping
  triggers:
  - type: kafka                    # the stable scaler
    metadata:
      bootstrapServers: kafka-bootstrap.kafka:9092
      consumerGroup: orders-processor
      topic: orders                # always explicit
      lagThreshold: "500"          # ≈ one pod's work per polling interval
      activationLagThreshold: "20" # above the idle lag floor
      offsetResetPolicy: earliest  # must match the consumer's auto.offset.reset
      excludePersistentLag: "true"
    authenticationRef:
      name: kafka-scram-auth
The rules worth internalising
- Use
type: kafka. Choose the experimental one only for multi-topic triggers. - Always set
topicexplicitly. - Leave
allowIdleConsumers: falseand pinmaxReplicaCountto the partition count. - Derive
lagThresholdfrom measured throughput — one pod’s work per polling interval. - Raise
activationLagThresholdabove the topic’s idle lag floor, or you’ll never reach zero. - Add a scale-up stabilisation window. The default is none, and every scale event costs a rebalance.
- Alert on real Kafka lag, never on KEDA’s reported metric.
- Match
offsetResetPolicyto your consumer’sauto.offset.reset. Mismatching them is the single most common Kafka-on-KEDA bug. - Choose composite partition counts (12, 24, 48) when creating topics you’ll autoscale.
Try it
06 - LAB 2 — Your First Kafka ScaledObject runs this config against a real 12-partition topic on your laptop, and 09 - LAB 3 — Break It on Purpose deliberately triggers the gotchas above so you can watch each one happen and then fix it.
8. Questions you should be able to answer
- Who computes the replica count — KEDA or the HPA? (The HPA. KEDA only reports lag and handles zero.)
- Why might KEDA’s metric show 6,000 when Kafka says lag is 90,000? (The partition ceiling: KEDA caps the reported number at
partitions × lagThreshold.) - Your consumer is at
maxReplicaCount, lag is climbing, and Kafka’s CPU is idle. First thing you check? (Whether the consumer is committing offsets at all.) - Why won’t a workload on a transactional topic scale to zero? (Transaction markers leave a permanent lag floor;
activationLagThresholdis too low.) - A 13-partition topic jumps from 1 pod to 13 with nothing in between. Why? (
ensureEvenDistributionOfPartitionson a prime partition count.) - One partition is hot and lag is growing. Will more pods help? (No — one owner per partition. Fix the producer’s partition key.)
- Why is adding pods aggressively not free? (Each scale event rebalances the group and briefly pauses consumption.)
9. Sources
- KEDA — Apache Kafka scaler (documents
type: kafka) - KEDA — Apache Kafka (Experimental) scaler (documents
type: apache-kafka) - KEDA — ScaledObject specification
- KEDA — Scaling Deployments: activation vs scaling
- Kubernetes — HorizontalPodAutoscaler walkthrough
- Kubernetes — Pod lifecycle and termination
- Apache Kafka — consumer configuration
- Apache Kafka — log compaction keeps offsets valid