03 - KEDA Architecture — Operator, Metrics Adapter & the HPA It Owns
18 min read
Scope
What KEDA actually installs, and which component makes which decision. The single idea that makes everything else in this track obvious: KEDA does not replace the HorizontalPodAutoscaler — it creates one, owns it, feeds it, and takes over exactly one job the HPA cannot do, which is crossing zero. By the end you should be able to look at a stuck workload and say “that’s the HPA’s problem” or “that’s KEDA’s problem” without guessing. Builds on 01 - Why Event-Driven Autoscaling — The Limits of HPA; every later module leans on the ownership split established here.
Component names, ports and the HPA-naming rule below are current for v2.20. KEDA’s CRDs are still v1alpha1 and will stay there, so breaking changes ship in minor releases — pin your version and read the release notes before upgrading.
1. The three things KEDA installs
A default install puts three Deployments in the keda namespace, plus six CRDs. That’s it — no DaemonSet, no sidecars, nothing injected into your pods.
Component
What it’s for
Talks to
operator
watches your ScaledObjects, polls your event sources, creates and owns the HPA, and does all scaling to and from zero itself
your event source (Kafka, SQS, …), the Kubernetes API
metrics API server
serves metric values to the HPA through the Kubernetes external-metrics API
the Kubernetes aggregation layer, and the operator
admission webhooks
validate ScaledObjects and friends at the moment you kubectl apply them
the Kubernetes API server only
Confirm they’re up before debugging anything else:
kubectl get deploy -n kedakubectl get crd | grep keda.sh
Gotcha — the deployment names depend on how you installed
The Helm chart and the released YAML manifests do not agree on two of the three names, which breaks copy-pasted kubectl logs commands and Prometheus scrape configs alike.
Role
Helm
Raw YAML manifests
operator
keda-operator
keda-operator
metrics adapter
keda-operator-metrics-apiserver
keda-metrics-apiserver
webhooks
keda-admission-webhooks
keda-admission
Mitigation: never hard-code the name. Select by label instead — kubectl logs -n keda -l app.kubernetes.io/name=keda-operator — or just run kubectl get deploy -n keda first. Note the webhook Service is called keda-admission-webhooks under both installs, so the Service and Deployment names differ under raw YAML.
Only the operator ever touches your event source. This is worth saying out loud because it shapes your network policies, your broker connection counts and your credential blast radius: your Kafka brokers see connections from the operator pod and nowhere else. The metrics adapter has no Kafka client in it at all.
2. KEDA creates an HPA for you — this is the “aha”
Apply a ScaledObject and look at what appears next to it:
kubectl apply -f orders-scaledobject.yamlkubectl get hpa
That is a completely ordinary autoscaling/v2 HorizontalPodAutoscaler. You didn’t write it; KEDA did. It is named keda-hpa-<scaledobject-name> by default, and it is what performs the actual replica arithmetic (07 - The Kafka Scaler — Every Field & the Replica Math).
Abridged, it looks like this:
apiVersion: autoscaling/v2kind: HorizontalPodAutoscalermetadata: name: keda-hpa-orders-consumer ownerReferences: # ← this is why you never delete it by hand - apiVersion: keda.sh/v1alpha1 kind: ScaledObject name: orders-consumer controller: true blockOwnerDeletion: truespec: scaleTargetRef: apiVersion: apps/v1 kind: Deployment name: orders-consumer minReplicas: 1 # ← 1 even though minReplicaCount is 0. See §5 maxReplicas: 12 metrics: - type: External external: metric: name: s0-kafka-orders # s<trigger index>-<scaler>-<detail> selector: matchLabels: scaledobject.keda.sh/name: orders-consumer target: type: AverageValue averageValue: "500" # ← your lagThreshold, verbatim
Three things to notice, because each explains a behaviour you’ll meet later:
Your threshold becomes the HPA’s metric target.lagThreshold: "500" isn’t consumed by KEDA’s own logic at all for the 1↔N range — it is handed to the HPA as an AverageValue target of 500, and the HPA divides total lag by it. The default metric type is AverageValue; you can change it per trigger (04 - The ScaledObject CRD, End to End).
The metric is named per trigger, with an index.s0- is the first trigger, s1- the second. The label selector on it — scaledobject.keda.sh/name — is how KEDA’s metrics server knows which ScaledObject a query is about. You’ll need that selector by hand when you query the metrics API directly for debugging (14 - Observability & Debugging — Why Isn’t It Scaling).
The ownerReference makes the HPA a child of the ScaledObject. Delete the ScaledObject and Kubernetes garbage-collects the HPA for you. Delete the HPA by hand and the operator just recreates it on its next reconcile. You should treat the HPA as read-only output; to change it, change spec.advanced.horizontalPodAutoscalerConfig on the ScaledObject.
Best practice — read the generated HPA when you're confused
kubectl describe hpa keda-hpa-<name> is the highest-value debugging command in KEDA, and almost nobody runs it. It shows you the metric value the HPA is actually seeing, its ScalingActive condition, and the scale events it decided on — the three facts you need to tell “the metric is wrong” apart from “the metric is fine and the HPA chose not to act.”
3. The request path, as a story
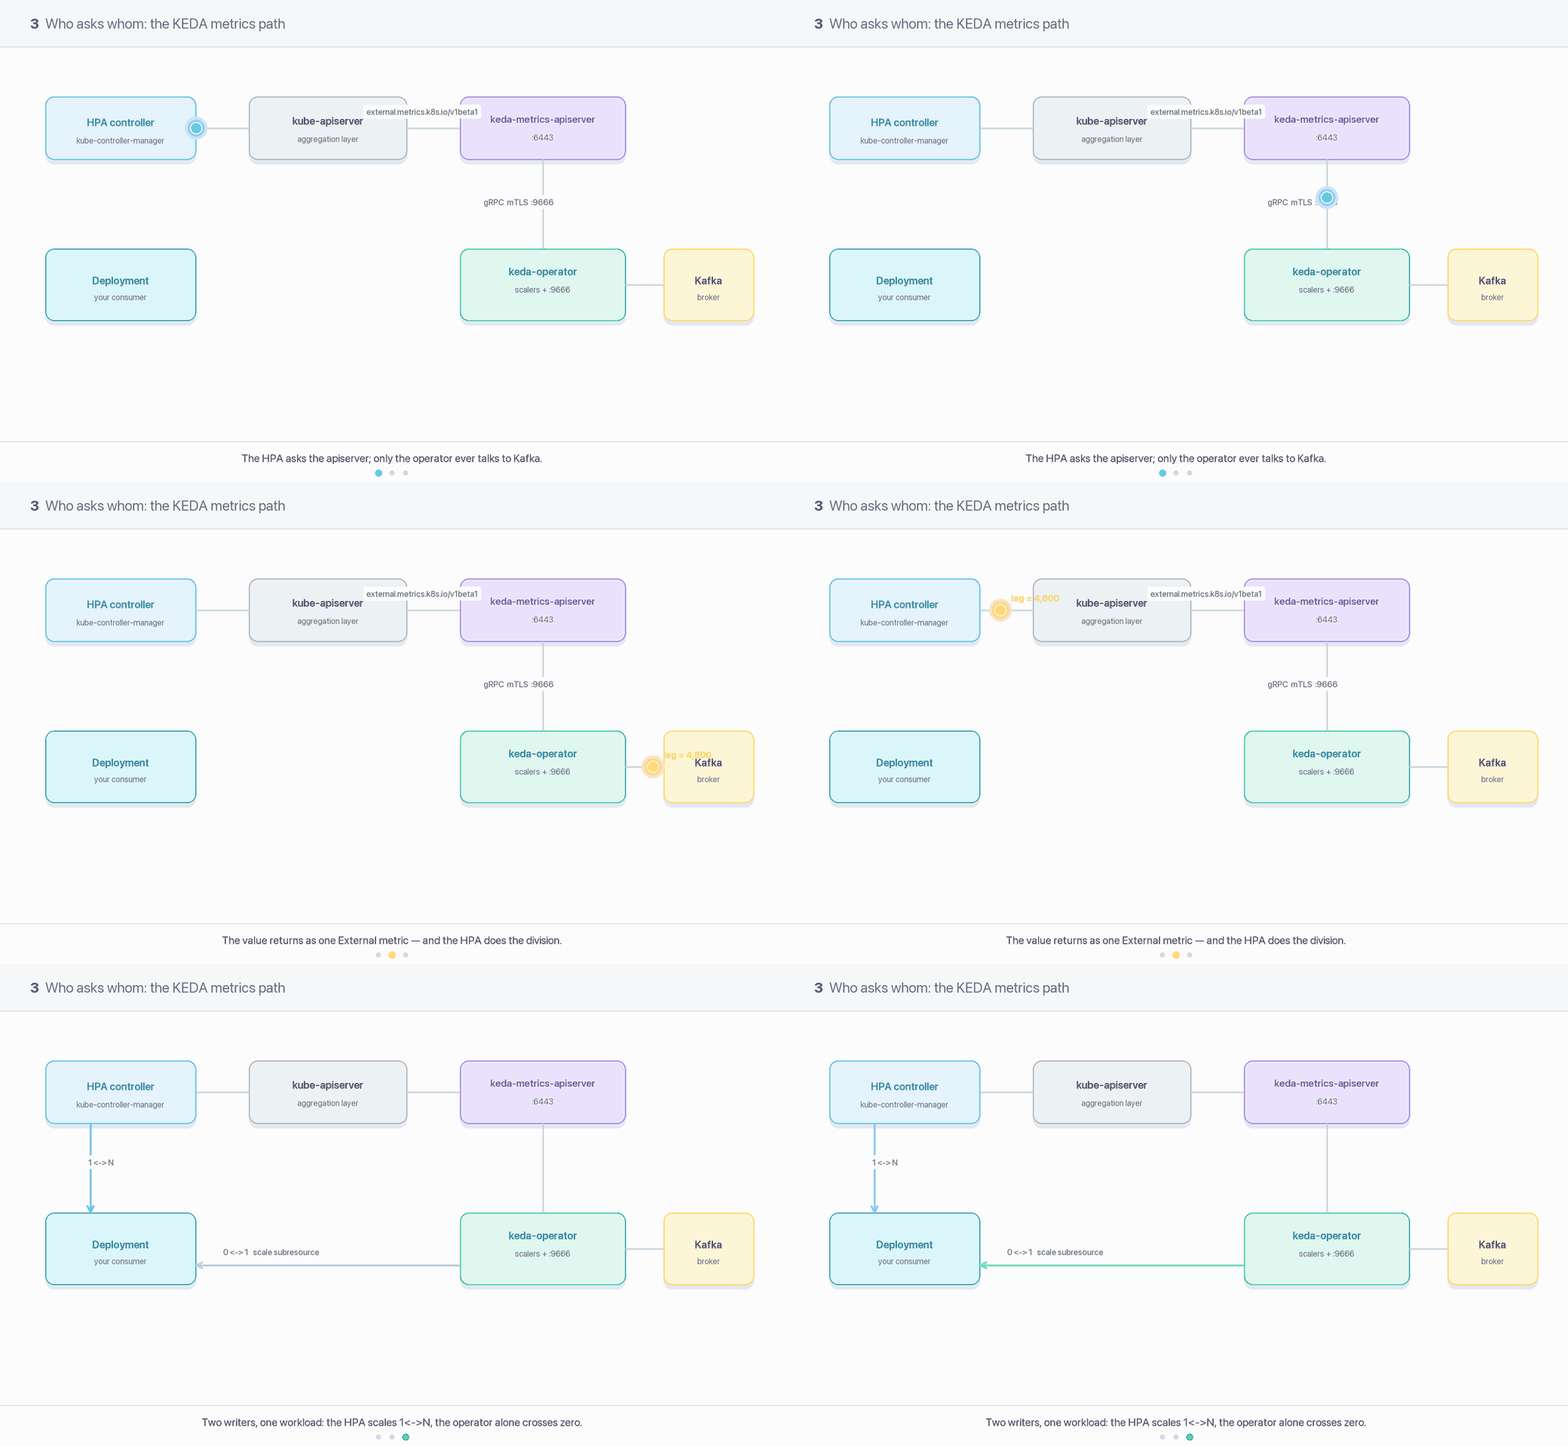
Nothing in KEDA pushes metrics anywhere. The whole system is a chain of pulls, and it starts with the HPA — which, like every HPA, wakes up roughly every 15 seconds.
The HPA controller wants its metric. It’s holding an External metric spec named s0-kafka-orders, so it asks the Kubernetes API server for that metric, passing the label selector.
The API server doesn’t own that API group.external.metrics.k8s.io isn’t built in. The aggregation layer looks up which service has registered to serve it and forwards the request there.
That service is KEDA’s metrics API server. It receives the request, pulls the ScaledObject name out of the label selector, and — this is the part people don’t expect — asks the operator, over an internal, mutually-authenticated connection inside the cluster.
The operator answers from what its scalers last collected. It does not go and ask Kafka at this moment. A background loop already polled Kafka every pollingInterval (default 30 s) and knows the answer.
The HPA divides the returned value by its target and writes a new replica count to your Deployment’s scale subresource.
You can walk the same path by hand. The registration:
kubectl get apiservice v1beta1.external.metrics.k8s.io
NAME SERVICE AVAILABLE AGEv1beta1.external.metrics.k8s.io keda/keda-metrics-apiserver True 6d
And the metric itself — note the selector is mandatory, and URL-encoded:
kubectl get --raw "/apis/external.metrics.k8s.io/v1beta1/namespaces/prod/s0-kafka-orders?labelSelector=scaledobject.keda.sh%2Fname%3Dorders-consumer" | jq .
If that command returns a number, the entire read path is healthy and any scaling problem is above it, in the HPA or in your thresholds. If it errors, the problem is below it. That one distinction saves hours.
Two consequences of the operator being the only Kafka client
Your metric is at most one pollingInterval old, no matter how often the HPA syncs. And the operator is a single point of read: if it’s wedged, the metrics server has nothing to serve and the HPA’s metric goes unavailable — which, on a multi-trigger workload, freezes scale-down entirely (11 - Multiple Triggers, Scaling Modifiers & Fallback).
If you run a restrictive network policy or a cloud firewall between the control plane and the keda namespace, three ports matter: 443 for the API server reaching the metrics service, 6443 as the metrics pod’s own TLS port (relevant on GKE/EKS, where the control plane is outside your VPC), and 9666 for the operator-to-adapter channel.
4. Who decides what — the table to memorise
Decision
Owner
Create, update, delete the HPA
KEDA operator
Poll the event source; produce a metric value and an “is there work?” boolean
KEDA operator, every pollingInterval
Serve values on external.metrics.k8s.io
KEDA metrics API server (relaying from the operator)
0 → 1 (or 0 → minReplicaCount) — activation
KEDA operator, writing the scale subresource directly
N → 0 (or → idleReplicaCount) — deactivation
KEDA operator, writing the scale subresource directly
1 → N and N → 1 arithmetic, stabilisation windows, scaling policies, tolerance
HPA controller (part of kube-controller-manager)
CPU / memory metric values
metrics-server, read by the HPA directly — KEDA is not in the path
KEDA’s own documentation draws the line in one sentence:
The activating (or deactivating) phase is the moment when KEDA (operator) has to decide if the workload should be scaled from/to zero. The scaling phase is the moment when KEDA has decided to scale out to 1 instance and now it is the HPA controller who takes the scaling decisions.
KEDA owns crossing zero. The HPA owns everything from one upwards. Internalise that and most “why isn’t it scaling” questions answer themselves, because you immediately know which component’s knobs and which component’s logs to look at.
5. How KEDA crosses zero
An HPA’s minReplicas cannot be 0 — the Kubernetes feature that would allow it has been sitting behind an alpha gate for years and is off in every cluster you’ll meet. So KEDA sidesteps the problem rather than solving it: the HPA it generates always has minReplicas: 1, even when your minReplicaCount is 0.
The HPA therefore never sees zero and never has an opinion about it. When the operator decides the workload should be off, it writes replicas: 0 to the scale subresource itself, behind the HPA’s back. When work arrives, it writes 1 (or your minReplicaCount, if you set one above zero) and then steps out of the way and lets the HPA take over.
Note the asymmetry that trips people up: spec.minReplicaCount defaults to 0, but the generated HPA’s floor is 1. Seeing MINPODS 1 in kubectl get hpa on a scale-to-zero workload is correct and expected, not a misconfiguration.
This single mechanism is why the knobs are split the way they are:
Knob
Whose business
Governs
per-scaler activation threshold (activationLagThreshold on Kafka)
KEDA
whether 0 → 1 happens at all
cooldownPeriod (default 300 s)
KEDA
how long after the last activity before the final step to zero
the trigger’s main threshold (lagThreshold)
handed to the HPA
the 1 ↔ N replica arithmetic
behavior.scaleDown.stabilizationWindowSeconds and friends
HPA
how twitchy 1 ↔ N is
Two direct consequences, both of which have their own module:
Activation is a separate decision from scaling, with its own threshold, evaluated only inside the operator, and it is ignored entirely if minReplicaCount >= 1 (there’s no zero to cross). See 08 - Scale-to-Zero & Activation.
cooldownPeriod is not “the scale-down delay.” It only gates the last step, to zero or idle. The delay you’re actually looking for when scaling from 8 pods down to 3 is the HPA’s stabilisation window. This is the most-misunderstood pair of settings in KEDA — 10 - Tuning Scaling Behaviour is dedicated to untangling it.
6. One external-metrics provider per cluster — a hard constraint
Gotcha — KEDA cannot coexist with another external-metrics adapter
Kubernetes allows exactly one service to be registered for external.metrics.k8s.io per cluster. KEDA claims it. If your cluster already runs something else that serves external metrics — most commonly prometheus-adapter configured with externalRules — installing KEDA means one of the two loses, and which one loses is decided by the registration that landed last. Everything downstream of the loser silently stops getting metrics, with no error on your ScaledObject and no error on the other adapter’s own resources.
This is the single biggest surprise when adopting KEDA into an established cluster, and it is easy to miss because a fresh kind cluster never has the conflict.
Mitigation: before installing, run kubectl get apiservice v1beta1.external.metrics.k8s.io. If it already exists and points at something other than KEDA, you have a migration to plan, not an install to run. The usual answer is to move those metrics into KEDA — the prometheus trigger covers most externalRules use cases and gives you scale-to-zero for free — and then remove the other adapter’s external-metrics registration. Note this constraint does not apply to custom.metrics.k8s.io or metrics.k8s.io, so prometheus-adapter serving custom (per-object) metrics and metrics-server serving CPU/memory both coexist with KEDA happily.
7. CPU and memory are the exception
If you add a cpu or memory trigger to a ScaledObject, KEDA writes a plain Resource metric into the generated HPA and gets out of the way. KEDA’s docs are explicit:
There are 2 exceptions in querying metrics and those are cpu and memory scalers. When KEDA creates the HPA object, it uses standard cpu and memory metrics from the Kubernetes Metrics Server.
So a CPU trigger under KEDA is exactly a CPU-based HPA, with the values coming from metrics-server as usual. Two practical results:
A CPU or memory trigger cannot scale to zero. There’s no activation concept for it, and a workload at zero replicas has no CPU to measure — which is why the admission webhook rejects a ScaledObject whose triggers are only cpu/memory when minReplicaCount: 0. Pair them with a real event trigger, or set a floor of 1.
Debugging them is HPA debugging, not KEDA debugging. If a CPU trigger shows <unknown>, check metrics-server and your container’s resource requests (the webhook will also reject the ScaledObject if the target container has no request defined for the resource you’re scaling on). KEDA’s logs will tell you nothing, because KEDA isn’t involved.
8. Gotchas that bite in production
Gotcha — putting your own HPA on a ScaledObject-managed workload
Two autoscalers on one scale subresource fight. They read different signals, compute different answers and overwrite each other every few seconds; the workload oscillates and neither controller reports anything wrong. KEDA’s FAQ is blunt about it: “We recommend not to combine using KEDA’s ScaledObject with a Horizontal Pod Autoscaler (HPA) to scale the same workload. They will compete with each other.”
The admission webhook prevents the common ordering — apply a ScaledObject onto a workload that already has a hand-written HPA and it’s rejected with a message naming the offending HPA. But the reverse order isn’t guarded: nothing stops you creating an HPA afterwards on a workload KEDA already manages.
Mitigation: pick one autoscaler per workload, and if you’re migrating an existing HPA into KEDA, do it deliberately rather than by deleting things. KEDA supports adopting the HPA: put scaledobject.keda.sh/transfer-hpa-ownership: "true" on the ScaledObjectand set spec.advanced.horizontalPodAutoscalerConfig.name to the existing HPA’s exact name — both are required, and the apply is rejected if the name doesn’t match.
metadata: name: orders-consumer annotations: scaledobject.keda.sh/transfer-hpa-ownership: "true"spec: advanced: horizontalPodAutoscalerConfig: name: my-existing-orders-hpa # must match the HPA already there
There is also an escape hatch for the ownership check — an annotation you put on the HPA to make KEDA ignore it — but the docs warn it “exposes the system to potential risks,” and it leaves you with two competing autoscalers by design. Prefer the transfer.
Gotcha — the metrics APIService isn't Available and everything fails quietly
If v1beta1.external.metrics.k8s.io is registered but not Available, your ScaledObject can still look fine. The failure surfaces one level down, in the HPA, as FailedGetExternalMetric and an unavailable target — so a workload sits pinned at its current replica count indefinitely. Common causes: the metrics pod isn’t ready; its serving certificate is stale; or, on EKS with a custom CNI or GKE private clusters, the control plane simply can’t reach port 6443 in your VPC because a firewall rule was never opened.
Mitigation: make kubectl get apiservice v1beta1.external.metrics.k8s.io an install-time check and a monitored alert — it is the one signal that covers the whole read path. When it’s False, read the Message column, then kubectl describe hpa for the downstream symptom, then the metrics-apiserver pod logs. On EKS with a custom CNI, the chart offers a host-network option for the webhook precisely because of this class of reachability problem.
Gotcha — scaling the operator up does not add throughput
The obvious reaction to “KEDA is slow to react with 800 ScaledObjects” is --set operator.replicaCount=3. It does nothing for throughput. The operator is leader-elected: exactly one replica reconciles and polls, and the others sit idle waiting to take over. A second replica buys you a shorter failover window (roughly the lease duration) and nothing else. KEDA’s docs say plainly that it “does not provide full support for high-availability due to upstream limitations”: the supported counts are 2 for the operator and 1 for the metrics server — and the metrics server is limited to one because only one service can serve the external-metrics API.
Mitigation: treat KEDA as vertically scaled. Raise the operator’s CPU and memory limits (the defaults are 1 CPU / 1000Mi), lengthen pollingInterval on the workloads that don’t need 30-second reaction, and turn on useCachedMetrics so the HPA’s frequent syncs don’t multiply into event-source calls (04 - The ScaledObject CRD, End to End). For genuinely large fleets, shard by cluster or scope operators with watchNamespace (15 - Production Operations). Run 2 operator replicas for failover, never for capacity.
Gotcha — deleting a ScaledObject does not put your replicas back
The HPA is garbage-collected cleanly, which feels tidy — so people assume the workload is restored too. It isn’t. Removing the ScaledObject from a workload currently sitting at zero replicas leaves it at zero, with nothing left in the cluster that will ever scale it up. Restoring the original count is opt-in via spec.advanced.restoreToOriginalReplicaCount: true. Mitigation: set that field on every scale-to-zero ScaledObject as a matter of course, and after any deletion check kubectl get deploy rather than trusting the tidy kubectl delete output. Covered in full in 04 - The ScaledObject CRD, End to End.
9. Alternatives — other ways to scale on an external signal
Approach
How it works
Choose it when
KEDA
operator polls 60+ sources, generates and owns an HPA, handles 0↔1 itself
you want an event-source signal, scale-to-zero, or both — the default answer for queue- and topic-driven workloads
prometheus-adapter + your own HPA
adapter turns PromQL into custom/external metrics; you write the HPA
your signal is already a Prometheus metric, you never need zero, and you’d rather not add a new controller. Remember the one-provider constraint if it serves external metrics
A custom metrics adapter you write
implement the external-metrics API yourself against the aggregation layer
your signal is genuinely unavailable to anything off the shelf — rare, and note KEDA’s external (gRPC) scaler gets you the same freedom for far less code
Knative Serving
its own request-driven autoscaler with built-in scale-to-zero and activation buffering
the workload is a request/response HTTP service and you want per-request concurrency scaling plus queueing during cold start. Not a fit for a Kafka consumer, which has no inbound requests to count
KEDA and Knative can coexist in one cluster on different workloads. KEDA and prometheus-adapter can coexist as long as the adapter serves only custom metrics. And KEDA sits above node autoscaling, not beside it — Cluster Autoscaler or Karpenter still has to find nodes for the pods KEDA asks for, and that interaction has its own failure modes (15 - Production Operations). Full comparison in 16 - Alternatives & Trade-offs.
10. Questions you should be able to answer
What are the three KEDA components, and which one connects to Kafka? (Operator, metrics API server, admission webhooks — only the operator talks to Kafka.)
Where does keda-hpa-orders come from, and what happens if you delete it? (KEDA generated it; it’s owned by the ScaledObject, and the operator recreates it on the next reconcile.)
Trace an HPA metric read end to end. (HPA controller → API server → aggregation layer → KEDA metrics API server → operator → last polled scaler value.)
kubectl get hpa shows MINPODS 1 but your minReplicaCount is 0. Bug? (No — the generated HPA always has a floor of 1 so it never sees zero; the operator writes 0 to the scale subresource itself.)
Who owns 0→1? Who owns 4→9? (KEDA operator; HPA controller.)
Why can’t you run KEDA and prometheus-adapter’s external-metrics rules together? (Kubernetes supports one external.metrics.k8s.io provider per cluster.)
Your ScaledObject is Ready but the workload never scales, and the HPA says the metric is unavailable. Where do you look first? (kubectl get apiservice v1beta1.external.metrics.k8s.io, then the metrics-apiserver pod.)
Will three operator replicas make KEDA react faster? (No — leader election means one is active. It only shortens failover.)
Why does a cpu trigger behave differently from a kafka trigger? (CPU/memory bypass KEDA entirely; the HPA reads them from metrics-server.)