Scope
Why the HorizontalPodAutoscaler — the thing Kubernetes gives you for free — is the wrong tool for a queue consumer, and what exactly KEDA adds on top of it. Two ideas to take away: CPU utilisation and queue backlog are independent quantities, so scaling on one tells you nothing about the other; and the HPA structurally cannot reach zero, because the lower bound of its own API is 1. Everything else in this track is machinery built around those two facts. Continues into 02 - Kafka Consumer Groups, Partitions & Rebalancing and 03 - KEDA Architecture — Operator, Metrics Adapter & the HPA It Owns.
Related: KEDA & Kafka Autoscaling, 02 - Kafka Consumer Groups, Partitions & Rebalancing, 03 - KEDA Architecture — Operator, Metrics Adapter & the HPA It Owns, 07 - The Kafka Scaler — Every Field & the Replica Math, 08 - Scale-to-Zero & Activation, 16 - Alternatives & Trade-offs
Written against KEDA v2.20 · Kubernetes 1.33–1.35 · Apache Kafka 4.3
The HPA formula and the
minReplicasrule below are stable across every Kubernetes version you’re likely to run. TheHPAScaleToZerofeature gate is the one thing to re-check — it has been alpha for a very long time, and if that ever changes, part of this module’s argument changes with it.
1. Kubernetes gives you three autoscalers, and they move different things
Before arguing about signals, get the vocabulary straight — because “it won’t scale” is asked about all three of these and the answer is different each time.
| Autoscaler | What it changes | Question it answers | Ships with Kubernetes? |
|---|---|---|---|
| HorizontalPodAutoscaler (HPA) | the number of pods | ”do I need more copies?” | ✓ built in |
| VerticalPodAutoscaler (VPA) | the CPU/memory requests of a pod | ”is each copy the right size?” | ✗ separate add-on |
| Cluster Autoscaler / Karpenter | the number of nodes | ”is there anywhere to put the pods?” | ✗ separate, cloud-specific |
They compose, and they compose in a specific order. The HPA asks for more pods; those pods go Pending if the cluster is full; the node autoscaler notices Pending pods and adds capacity. KEDA slots in at the same layer as the HPA — it decides pod counts — and it still depends on a node autoscaler underneath it to make those pods schedulable. A ScaledObject that asks for 40 pods on a cluster that can host 12 gives you 12 running pods and 28 Pending ones, and nothing in KEDA will tell you that’s what happened (15 - Production Operations).
Gotcha — the HPA and the VPA fight over CPU
Both watching the same CPU metric is a genuine conflict: the VPA lowers the request, which raises measured utilisation, which makes the HPA add pods, which lowers per-pod load, which makes the VPA lower the request again.
Mitigation: never point them at the same resource. Use the VPA for CPU/memory sizing only on workloads whose replica count you scale on something else entirely — which, once you’re using KEDA, is exactly your situation. KEDA scaling on queue depth plus the VPA sizing the container is a clean, non-conflicting combination.
2. How the HPA actually decides
There is one formula, and it is worth being able to write from memory:
desiredReplicas = ceil[ currentReplicas × ( currentMetricValue / desiredMetricValue ) ]
That’s it. The HPA measures something, divides by your target, multiplies by the current count, rounds up. It then clamps the result to [minReplicas, maxReplicas], ignores changes inside a small tolerance band (10% by default) so it doesn’t twitch, and applies stabilisation windows and rate policies before writing the number.
The interesting part isn’t the arithmetic — it’s where currentMetricValue comes from. The HPA supports three kinds of metric, and they’re the reason KEDA can exist at all:
| Metric type | Where the value comes from | Typical example | Scoped to |
|---|---|---|---|
| resource | metrics-server, reading the kubelet | CPU utilisation, memory | the target’s own pods |
| custom | a custom-metrics API adapter you install | requests/sec per pod from Prometheus | per-pod or per-object |
| external | an external-metrics API adapter you install | messages waiting in a queue | nothing in the cluster |
The distinction that matters: resource and custom metrics describe your pods. External metrics describe the world. An external metric has no requirement to come from anything running in your cluster — which is precisely why it can still have a value when your replica count is zero.
KEDA plugs into the external slot. It registers itself as an external-metrics API provider and publishes numbers like “total consumer lag on topic orders”. The HPA then does the same division it always does. That’s the whole integration: KEDA doesn’t extend, patch or replace the HPA controller — it feeds it, using an extension point Kubernetes documented years before KEDA existed. Details in 03 - KEDA Architecture — Operator, Metrics Adapter & the HPA It Owns.
One consequence worth noting now, because it explains a confusing behaviour later: KEDA’s cpu and memory triggers don’t go through KEDA’s metrics path at all. When it generates the HPA it emits standard resource metrics for those, served by metrics-server exactly as a hand-written HPA would be. KEDA is only in the loop for the external metrics.
You can watch the whole chain from the outside, which is the fastest way to convince yourself of all of the above:
kubectl get hpa                        # TARGETS column: current metric vs target
kubectl top pods                       # what metrics-server sees (resource metrics)
kubectl get apiservices | grep metrics # v1beta1.metrics.k8s.io and v1beta1.external.metrics.k8s.io
Gotcha — no metrics-server means a CPU HPA that silently never scales
A resource-metric HPA on a cluster without metrics-server installed shows
<unknown>/70%inkubectl get hpaand does nothing at all. Some distributions ship it; kind and several bare-metal setups don’t. It’s an easy hour to lose, and the failure is quiet — the HPA object exists and looks fine.
Mitigation: checkkubectl top podsreturns numbers before you trust any resource-metric HPA, and readkubectl describe hpa— theScalingActivecondition names the missing metric explicitly. The same discipline applies to KEDA:kubectl describe soandkubectl describe hpaboth carry the reason.
The mental model to hold
The HPA is a divider. It has never been an autoscaler with opinions — it takes a number, divides by a target, and rounds up. Every autoscaling argument is really an argument about which number you feed it.
3. The core argument — CPU is the wrong signal for a queue consumer
Here is the case, and it is worth being able to make it in thirty seconds in an interview.
CPU-based scaling works when CPU is the bottleneck and CPU rises with demand. For a stateless HTTP service, that’s usually true: more requests, more parsing and serialising, more CPU. Utilisation is a decent proxy for load.
For a queue consumer, it breaks in both directions, and the symmetry is the point:
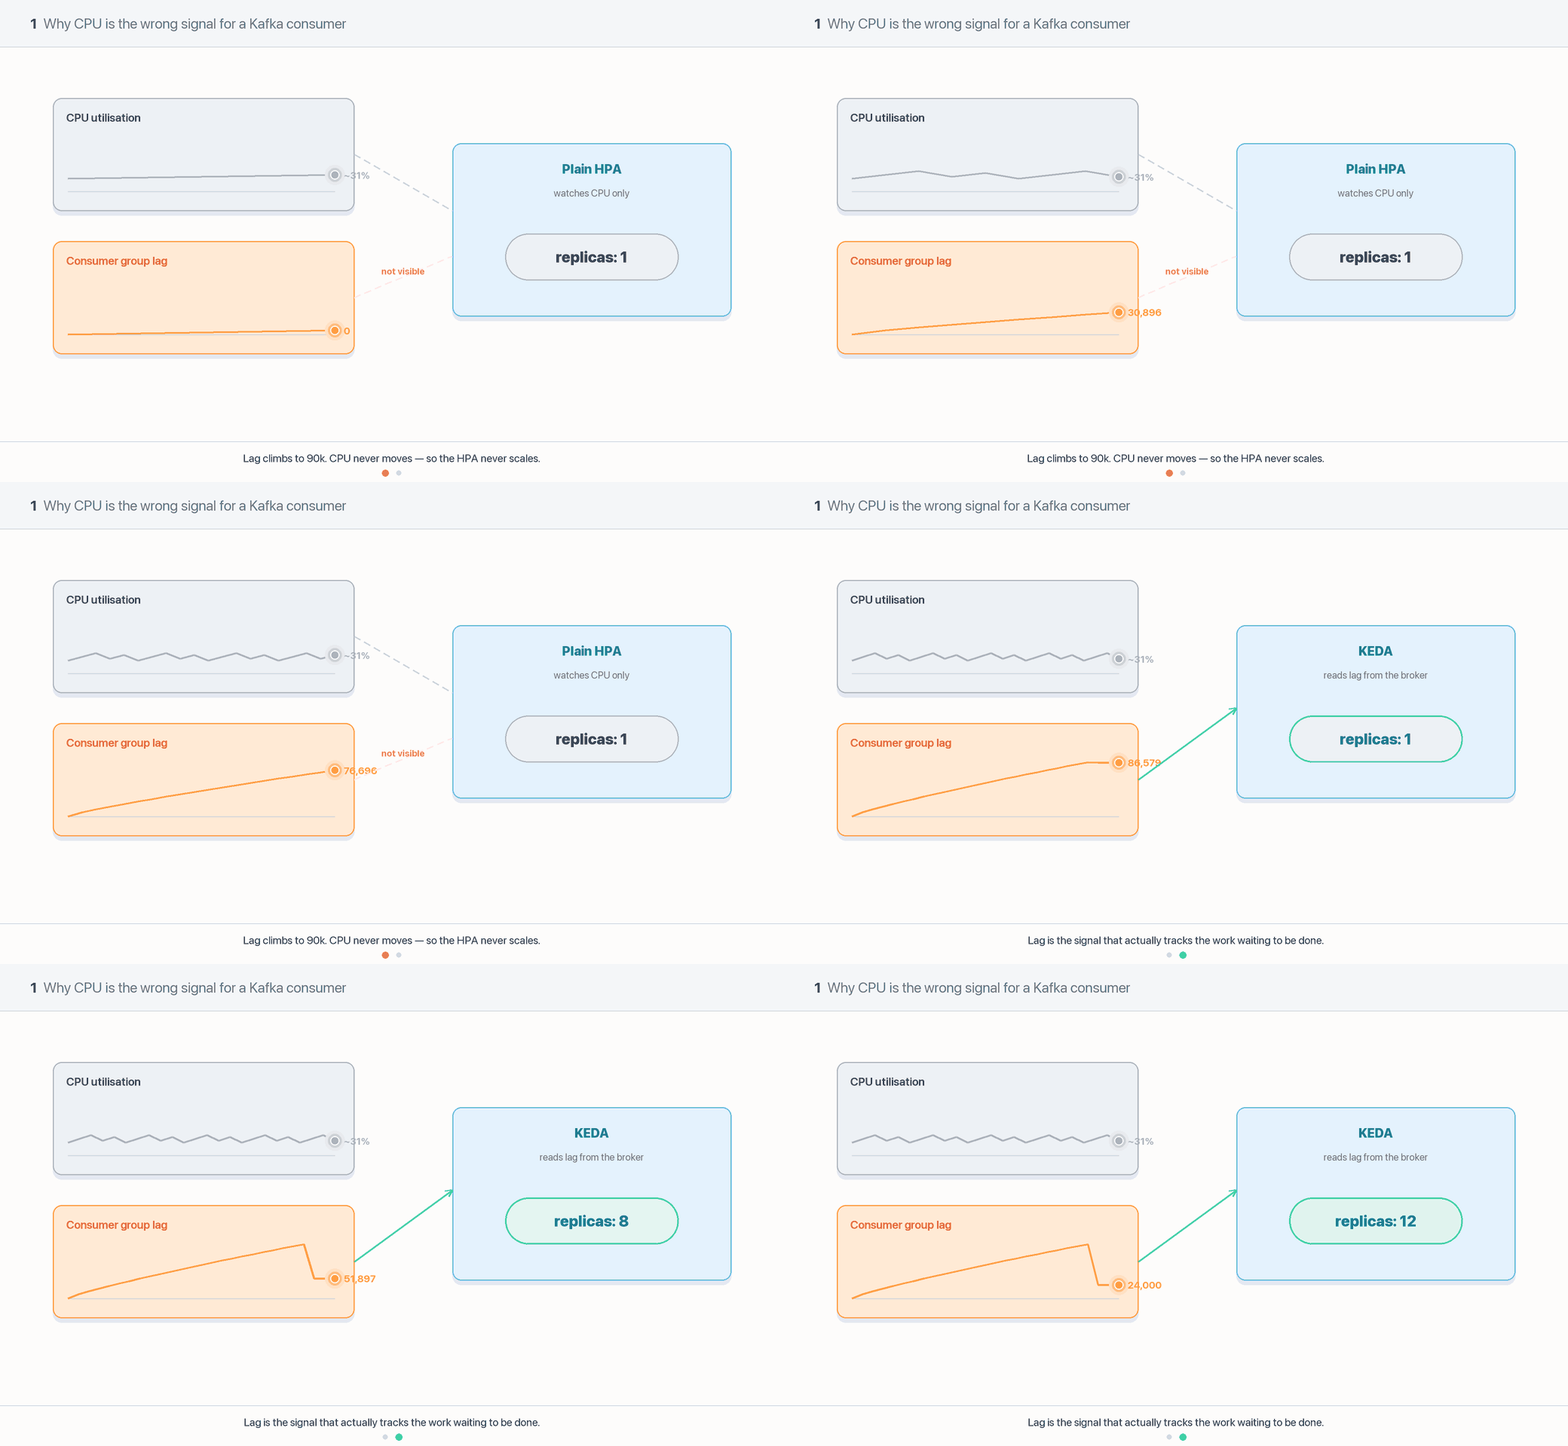
Case A — high backlog, no CPU. Your consumer pulls a message and calls a downstream API that takes 800 ms. The thread blocks. Backlog climbs into the hundreds of thousands. CPU sits at 3%, because waiting on a socket costs nothing. A CPU-target HPA sees a healthy, idle, over-provisioned workload and scales down — precisely when you needed it to scale up. This is the common case, because most consumers are I/O-bound: they call a database, an API, another queue.
Case B — no backlog, pinned CPU. Same consumer, different day. The topic is drained. But each message carries a fat Avro payload, and deserialisation plus validation plus JSON re-encoding is genuinely CPU-heavy. The last few messages of a burst pin CPU at 100%. A CPU-target HPA scales up to handle a queue that is already empty. You pay for pods, each new pod joins the consumer group and triggers a rebalance (02 - Kafka Consumer Groups, Partitions & Rebalancing), consumption briefly stops — and there was never any work to do.
So: CPU utilisation and queue depth are independent variables. You can have any combination of the four. Scaling on CPU when you care about backlog isn’t “a rough approximation”; it’s measuring an unrelated quantity and hoping. The signal you actually care about — how much work is waiting — lives in the broker, not in the pod.
Say it as a latency argument, not a cost argument
The reason to scale on backlog isn’t cost — it’s that backlog is the only signal with a direct relationship to your SLO. If the promise is “events are processed within 60 seconds”, then the thing to control is the queue, because queue depth divided by drain rate is your latency. CPU has no such relationship. Reframing it this way is what makes the argument land with people who think autoscaling is a billing optimisation.
4. Zero is a different problem, and it has two independent blockers
Scale-to-zero is the headline KEDA feature, and it’s blocked twice over. Both blockers are worth understanding separately, because they fail differently.
Blocker 1 — at zero replicas, there is nobody to report the metric
This is the elegant one, and it’s the argument most people miss.
Consumer lag is available as a client-side JMX metric — records-lag-max on the consumer’s fetch-manager MBean. Kafka’s own monitoring docs are explicit about who emits it:
Number of messages the consumer lags behind the producer by. Published by the consumer, not broker.
Read that again with autoscaling in mind. If you scrape lag from your consumer’s metrics endpoint — the obvious thing to do, and what a Prometheus-Adapter setup usually does — then at zero replicas the metric does not exist. No pods, no exporter, no scrape target, no data point. Your autoscaler is now blind exactly when it needs to notice that work has arrived. Even if you could reach zero, you could never come back: the number that would wake the workload is published by the workload.
KEDA sidesteps this by asking the broker instead. It talks to Kafka directly — where has this consumer group committed to, and where does the log end — and it does that from the KEDA operator, which is always running in its own namespace. The measurement is completely independent of whether your consumer exists. That is the mechanical reason KEDA can bring a workload up from zero, and a client-metrics pipeline fundamentally cannot.
Generalise it: scale-to-zero requires a metric source outside the thing being scaled. Every one of KEDA’s scalers is built that way — it queries the queue, the broker, the database, the cloud API. Never the pod.
Blocker 2 — the HPA’s floor is 1, by API definition
Even with a perfect always-available metric, the HPA won’t take you to zero. From the HorizontalPodAutoscaler v2 API reference:
minReplicasis the lower limit for the number of replicas to which the autoscaler can scale down. It defaults to 1 pod.minReplicasis allowed to be 0 if the alpha feature gate HPAScaleToZero is enabled and at least one Object or External metric is configured.
So there is an escape hatch — and it is not one you can use:
HPAScaleToZerohas been alpha since Kubernetes 1.16, and is still alpha today. Roughly a decade in alpha.- Alpha gates are disabled by default and enabling one means passing a flag to
kube-apiserverandkube-controller-manager. On EKS, GKE and AKS you do not get to do that. - Alpha features carry no compatibility promise and can be removed or changed in any release.
Treat it as unavailable. Not “risky” — unavailable. Any design that depends on it isn’t portable to a managed cluster, which is where your cluster almost certainly lives.
KEDA’s answer is to not fight this at all. The HPA it generates for you always has minReplicas: 1, even when you write minReplicaCount: 0 — and KEDA’s operator handles the 0↔1 transition itself by writing the replica count directly to the workload’s scale subresource. The HPA never sees zero and never needs to. This is the ownership split that runs through the whole track: KEDA owns 0↔1, the HPA owns 1↔N. See 03 - KEDA Architecture — Operator, Metrics Adapter & the HPA It Owns for the mechanics and 08 - Scale-to-Zero & Activation for the tuning.
5. So what does KEDA actually add?
Three things, and it’s worth being precise because “KEDA replaces the HPA” is the single most common misconception about it.
1. Event-driven triggers from 60+ sources. Kafka, RabbitMQ, SQS, Azure Service Bus, Pub/Sub, Prometheus, Postgres, cron, and an external-scaler gRPC contract for anything not in the list. You get a maintained integration instead of writing and operating a metrics adapter.
2. Scale-to-zero. The genuinely unique capability, for the two reasons in §4: broker-side measurement, and an operator that owns the zero transition outside the HPA.
3. A CRD that writes the HPA for you. You declare a ScaledObject; KEDA generates, owns, updates and garbage-collects the corresponding HPA. You never hand-write an External metric block or install an adapter.
KEDA complements the HPA — it does not replace it
Install KEDA and the HPA controller is still doing all the 1→N arithmetic, still applying stabilisation windows and rate policies, still the thing writing most of your replica changes. KEDA supplies the metric and handles the edges the HPA can’t reach. This matters practically: when a KEDA-scaled workload behaves oddly between 1 and N, the thing to debug is the HPA —
kubectl describe hpa keda-hpa-<name>— not KEDA. And when it’s stuck at 0 or won’t go to 0, that’s KEDA. Knowing which half owns the transition you’re looking at is most of the debugging.
Concretely, the before-and-after:
# Before — a hand-rolled HPA on CPU. Wrong signal, floor of 1.
apiVersion: autoscaling/v2
kind: HorizontalPodAutoscaler
metadata:
  name: orders-consumer
spec:
  scaleTargetRef:
    apiVersion: apps/v1
    kind: Deployment
    name: orders-consumer
  minReplicas: 1              # cannot be 0
  maxReplicas: 12
  metrics:
  - type: Resource
    resource:
      name: cpu
      target:
        type: Utilization
        averageUtilization: 70
# After — the same workload, scaled on the signal that matches the SLO.
apiVersion: keda.sh/v1alpha1
kind: ScaledObject
metadata:
name: orders-consumer
spec:
scaleTargetRef:
name: orders-consumer # apiVersion/kind default to apps/v1 Deployment
minReplicaCount: 0 # actually reachable
maxReplicaCount: 12 # = partition count, see module 02
pollingInterval: 30
cooldownPeriod: 300
triggers:
- type: kafka
metadata:
bootstrapServers: kafka-bootstrap.kafka:9092
consumerGroup: orders-workers
topic: orders
lagThreshold: "500" # backlog one pod is responsible forAnd the HPA that KEDA creates from it, which you can go and look at:
kubectl get hpa keda-hpa-orders-consumer -o yaml
# spec.minReplicas: 1              <- KEDA keeps the floor at 1 on purpose
# spec.metrics[0].type: External
# spec.metrics[0].external.metric.name: s0-kafka-orders

kubectl get so orders-consumer          # READY / ACTIVE / current replicas
kubectl describe hpa keda-hpa-orders-consumer   # where 1->N problems show up
Every field, default and status condition is in 04 - The ScaledObject CRD, End to End; the replica arithmetic is in 07 - The Kafka Scaler — Every Field & the Replica Math; you build this for real in 05 - LAB 1 — Local Cluster, Kafka & KEDA from Scratch.
6. The gotchas that catch people on day one
Gotcha — assuming CPU tracks queue depth "well enough"
The most expensive mistake in this module, because it fails silently and asymmetrically. An I/O-bound consumer with a growing backlog looks idle, so the HPA scales it down, which makes the backlog grow faster, which still looks idle. There’s no error, no event, no alert — just latency quietly missing its SLO while your dashboards show a comfortable 20% CPU.
Mitigation: scale on the backlog and use CPU only as a safety ceiling, never as the primary signal. If you take one rule from this module: the metric you scale on must be the metric your SLO is written against.
Gotcha — adding a CPU trigger to a ScaledObject silently breaks scale-to-zero
Adding a
cputrigger alongside your Kafka trigger looks harmless and defensive. It isn’t. A CPU trigger is active whenever pods are running and reporting CPU, so the “all triggers are inactive” condition that KEDA needs before it deactivates a workload is never satisfied. YourminReplicaCount: 0stops having any effect and the workload floors at 1 forever. There’s no error — KEDA is doing exactly what you told it.
KEDA does catch the degenerate version: a ScaledObject with only cpu/memory triggers andminReplicaCount: 0is rejected outright by the admission webhook, because scale-to-zero cannot work in that case. Mix a CPU trigger with a Kafka trigger and you’re past that guard, with the same behaviour and no warning.
Mitigation: don’t put CPU in a ScaledObject you intend to scale to zero. If you want a CPU safety net for a genuinely CPU-bound consumer, get it frommaxReplicaCountplus resource limits, or acceptminReplicaCount: 1as the price and say so in a comment. Also note the CPU/memory triggers require the container to declare the matchingresources.requests— omit it and the webhook rejects the object.
Gotcha — leaving your old HPA in place next to a ScaledObject
Two controllers writing
spec.replicason one Deployment is not a race you can win: each sees the other’s write as drift and corrects it, and the pod count oscillates indefinitely. KEDA’s own FAQ says plainly not to combine a ScaledObject with an HPA on the same workload — “they will compete with each other”.
KEDA’s admission webhook does try to stop you, rejecting a ScaledObject whose target is already managed by a foreign HPA (the workload '...' is already managed by the hpa '...'). But note two holes: the webhook’sfailurePolicyisIgnoreby default, so if the webhook pod is unavailable the create just goes through; and the check runs on the ScaledObject, so creating the HPA second isn’t blocked at all.
Mitigation: delete the old HPA as part of the same change that adds the ScaledObject — not afterwards. If you want KEDA to adopt an existing HPA instead of you deleting it, that’s what thetransfer-hpa-ownershipannotation is for, and it requires you to also setadvanced.horizontalPodAutoscalerConfig.nameto the existing HPA’s name. Setwebhooks.failurePolicy=Failin the Helm values if you want the guard to be real.
Gotcha — a cluster can only have one external-metrics provider
external.metrics.k8s.iois served through the Kubernetes aggregation layer, and an APIService is a singleton for its group and version. KEDA’s own FAQ states the limit plainly: Kubernetes currently supports only one metric server servingexternal.metrics.k8s.iometrics per cluster. So you cannot run KEDA alongside another adapter that serves external metrics — install KEDA on a cluster where the Prometheus Adapter is already registered for external metrics and one of them takes over the APIService, breaking every HPA that depended on the other. This is a cluster-wide, cross-team collision, and it doesn’t announce itself.
Mitigation: decide per cluster, not per team, who owns external metrics — and for an event-driven platform that should be KEDA. The Prometheus Adapter can coexist happily if it’s configured to serve only custom metrics (custom.metrics.k8s.io), which is a different APIService. Before installing, check:kubectl get apiservices v1beta1.external.metrics.k8s.io. This is also a real input to the alternatives table below — “KEDA and Prometheus Adapter for external metrics” is not one of the options.
Gotcha — expecting scale-to-zero to be free
Zero replicas means zero warm consumers. The first event after an idle period pays a cold start: KEDA notices it on the next
pollingInterval(default 30 s), then the pod schedules, the image pulls, the JVM or runtime starts, the Kafka client joins the group and a rebalance completes. Tens of seconds is normal; a fat JVM image on a cold node can be minutes.
Mitigation: only scale to zero where that latency is acceptable — batch, off-hours, genuinely bursty work. For latency-sensitive consumers useminReplicaCount: 1and take the cost. LowerpollingIntervalif you must, but understand you’re trading broker load for reaction time (10 - Tuning Scaling Behaviour).
7. Alternatives — what else could produce that number?
The choice isn’t “HPA or KEDA”. It’s “where does the metric come from, and who owns the zero transition”.
| Approach | What you get | Choose it when |
|---|---|---|
| HPA on resource metrics alone | zero extra components, built in, well understood | the workload is genuinely CPU- or memory-bound and demand is smooth — a stateless HTTP API. Not a queue consumer |
| HPA + Prometheus Adapter | any PromQL expression as a custom/external metric; reuses monitoring you already run | you already have Prometheus with reliable queue metrics, you don’t need scale-to-zero, and you’d rather own one adapter than a new operator. Note it’s mutually exclusive with KEDA if it serves external metrics |
| KEDA | 60+ maintained triggers, broker-side measurement, scale-to-zero, and it writes the HPA for you | anything event- or queue-driven; anything that should idle at zero; anything where you’d otherwise be plumbing a bespoke metrics pipeline. The default recommendation for a Kafka consumer |
| Knative Serving | request-driven autoscaling with scale-to-zero and activator-buffered cold starts, plus revisions and traffic splitting | the workload is HTTP request/response and you want a serverless platform, not just an autoscaler. It scales on requests in flight — it has nothing to say about a Kafka topic |
The committed recommendation: for a Kafka consumer, use KEDA. Not because the alternatives can’t be made to work, but because two of the three properties you need — a broker-side metric and a legitimate path to zero — are things you’d otherwise be building and operating yourself. The Prometheus Adapter route is a reasonable answer to “we already have Prometheus and we never idle”; it is not an answer to scale-to-zero, for the reason in §4.
Full treatment, including VPA and the node autoscalers, in 16 - Alternatives & Trade-offs.
8. Questions you should be able to answer
- Write the HPA’s replica formula. (
ceil[currentReplicas × (currentMetricValue / desiredMetricValue)].) - Name the HPA’s three metric types and say which one KEDA uses. (resource, custom, external — KEDA is an external-metrics provider.)
- Give two cases where CPU misleads a queue consumer, in opposite directions. (I/O-blocked: 0% CPU with a huge backlog → scales down. CPU-heavy deserialisation on a drained topic: 100% CPU with no backlog → scales up.)
- Why can’t a Prometheus-Adapter setup scraping consumer lag ever scale from zero? (Client-side lag is published by the consumer. At zero replicas nothing publishes it. KEDA asks the broker instead.)
- Can an HPA have
minReplicas: 0? (Only with theHPAScaleToZeroalpha gate — alpha since 1.16, off by default, unavailable on managed clusters. Not a production path.) - Does KEDA replace the HPA? (No. It creates and owns one, feeds it an external metric, and handles 0↔1 itself.)
- You add a CPU trigger to a working ScaledObject and it stops reaching zero. Why? (A CPU trigger is always active while pods run, so KEDA never sees all triggers inactive.)
- Someone leaves the old CPU HPA in place after adding a ScaledObject. What happens? (Both write
spec.replicas; the count oscillates. KEDA’s webhook rejects the ScaledObject — but itsfailurePolicyisIgnore, and creating the HPA second isn’t checked.) - The HPA asks for 40 pods and 28 stay Pending. Which autoscaler is the problem? (None of them — it’s node capacity. Cluster Autoscaler or Karpenter.)
- Can KEDA and the Prometheus Adapter run on the same cluster? (Only if the adapter serves custom metrics.
external.metrics.k8s.iosupports exactly one provider per cluster.) - A CPU-target HPA shows
<unknown>/70%. What’s missing? (metrics-server.kubectl top podswill also fail.)
9. Sources
- Kubernetes — HorizontalPodAutoscaler walkthrough and the replica formula
- Kubernetes — HorizontalPodAutoscaler v2 API reference (
minReplicas,HPAScaleToZero) - Kubernetes — Autoscaling Workloads (HPA, VPA, node autoscaling)
- Kubernetes — Feature gates
- Kubernetes — metrics-server
- KEDA — Scaling Deployments: activation vs scaling phase
- KEDA — ScaledObject specification
- KEDA — the scaler catalogue
- KEDA — CPU scaler
- KEDA — FAQ (do not combine a ScaledObject with an HPA)
- KEDA — admission webhooks
- Apache Kafka 4.3 — monitoring (
records-lag-maxis published by the consumer) - Kubernetes — Vertical Pod Autoscaler
- Karpenter documentation
- Prometheus Adapter (custom & external metrics from PromQL)
- Knative Serving — autoscaling